SECS/GEM simulator GUI
The PDComm SECS/GEM Simulator (pdcomm-simulator) is a Qt desktop app that plays either the Host or the Equipment side of a GEM connection. Use it as the peer of your own program when no real equipment is available, or run two copies against each other to watch the message flow. Every label in this guide appears in bold exactly as the app shows it.
Before you start, it helps to know:
- HSMS: active and passive mode, Select, and the session ID
- GEM state models: communication and control states
- GEM capabilities: SVIDs, CEIDs, RPTIDs, ALIDs, and the other identifiers
Start the simulator
Section titled “Start the simulator”The simulator/ folder of the SDK bundle holds the executables, the Qt libraries and plugins, and the license notices. Keep the folder intact and run the simulator from it.
& "$Root\simulator\pdcomm-simulator.exe""$PDCOMM_ROOT/simulator/pdcomm-simulator"simulator/pdcomm-simulator is a launcher script. It points the loader at the bundled lib/ and plugins/ folders and then runs bin/pdcomm-simulator. The GUI needs a desktop session; on a server without one, use the headless simulator instead.
open "$PDCOMM_ROOT/simulator/pdcomm-simulator.app"To pass command-line options, run the executable inside the app bundle:
"$PDCOMM_ROOT/simulator/pdcomm-simulator.app/Contents/MacOS/pdcomm-simulator"The window title reads PDComm SECS/GEM Simulator — Untitled. A leading * means you have unsaved changes.
Window layout
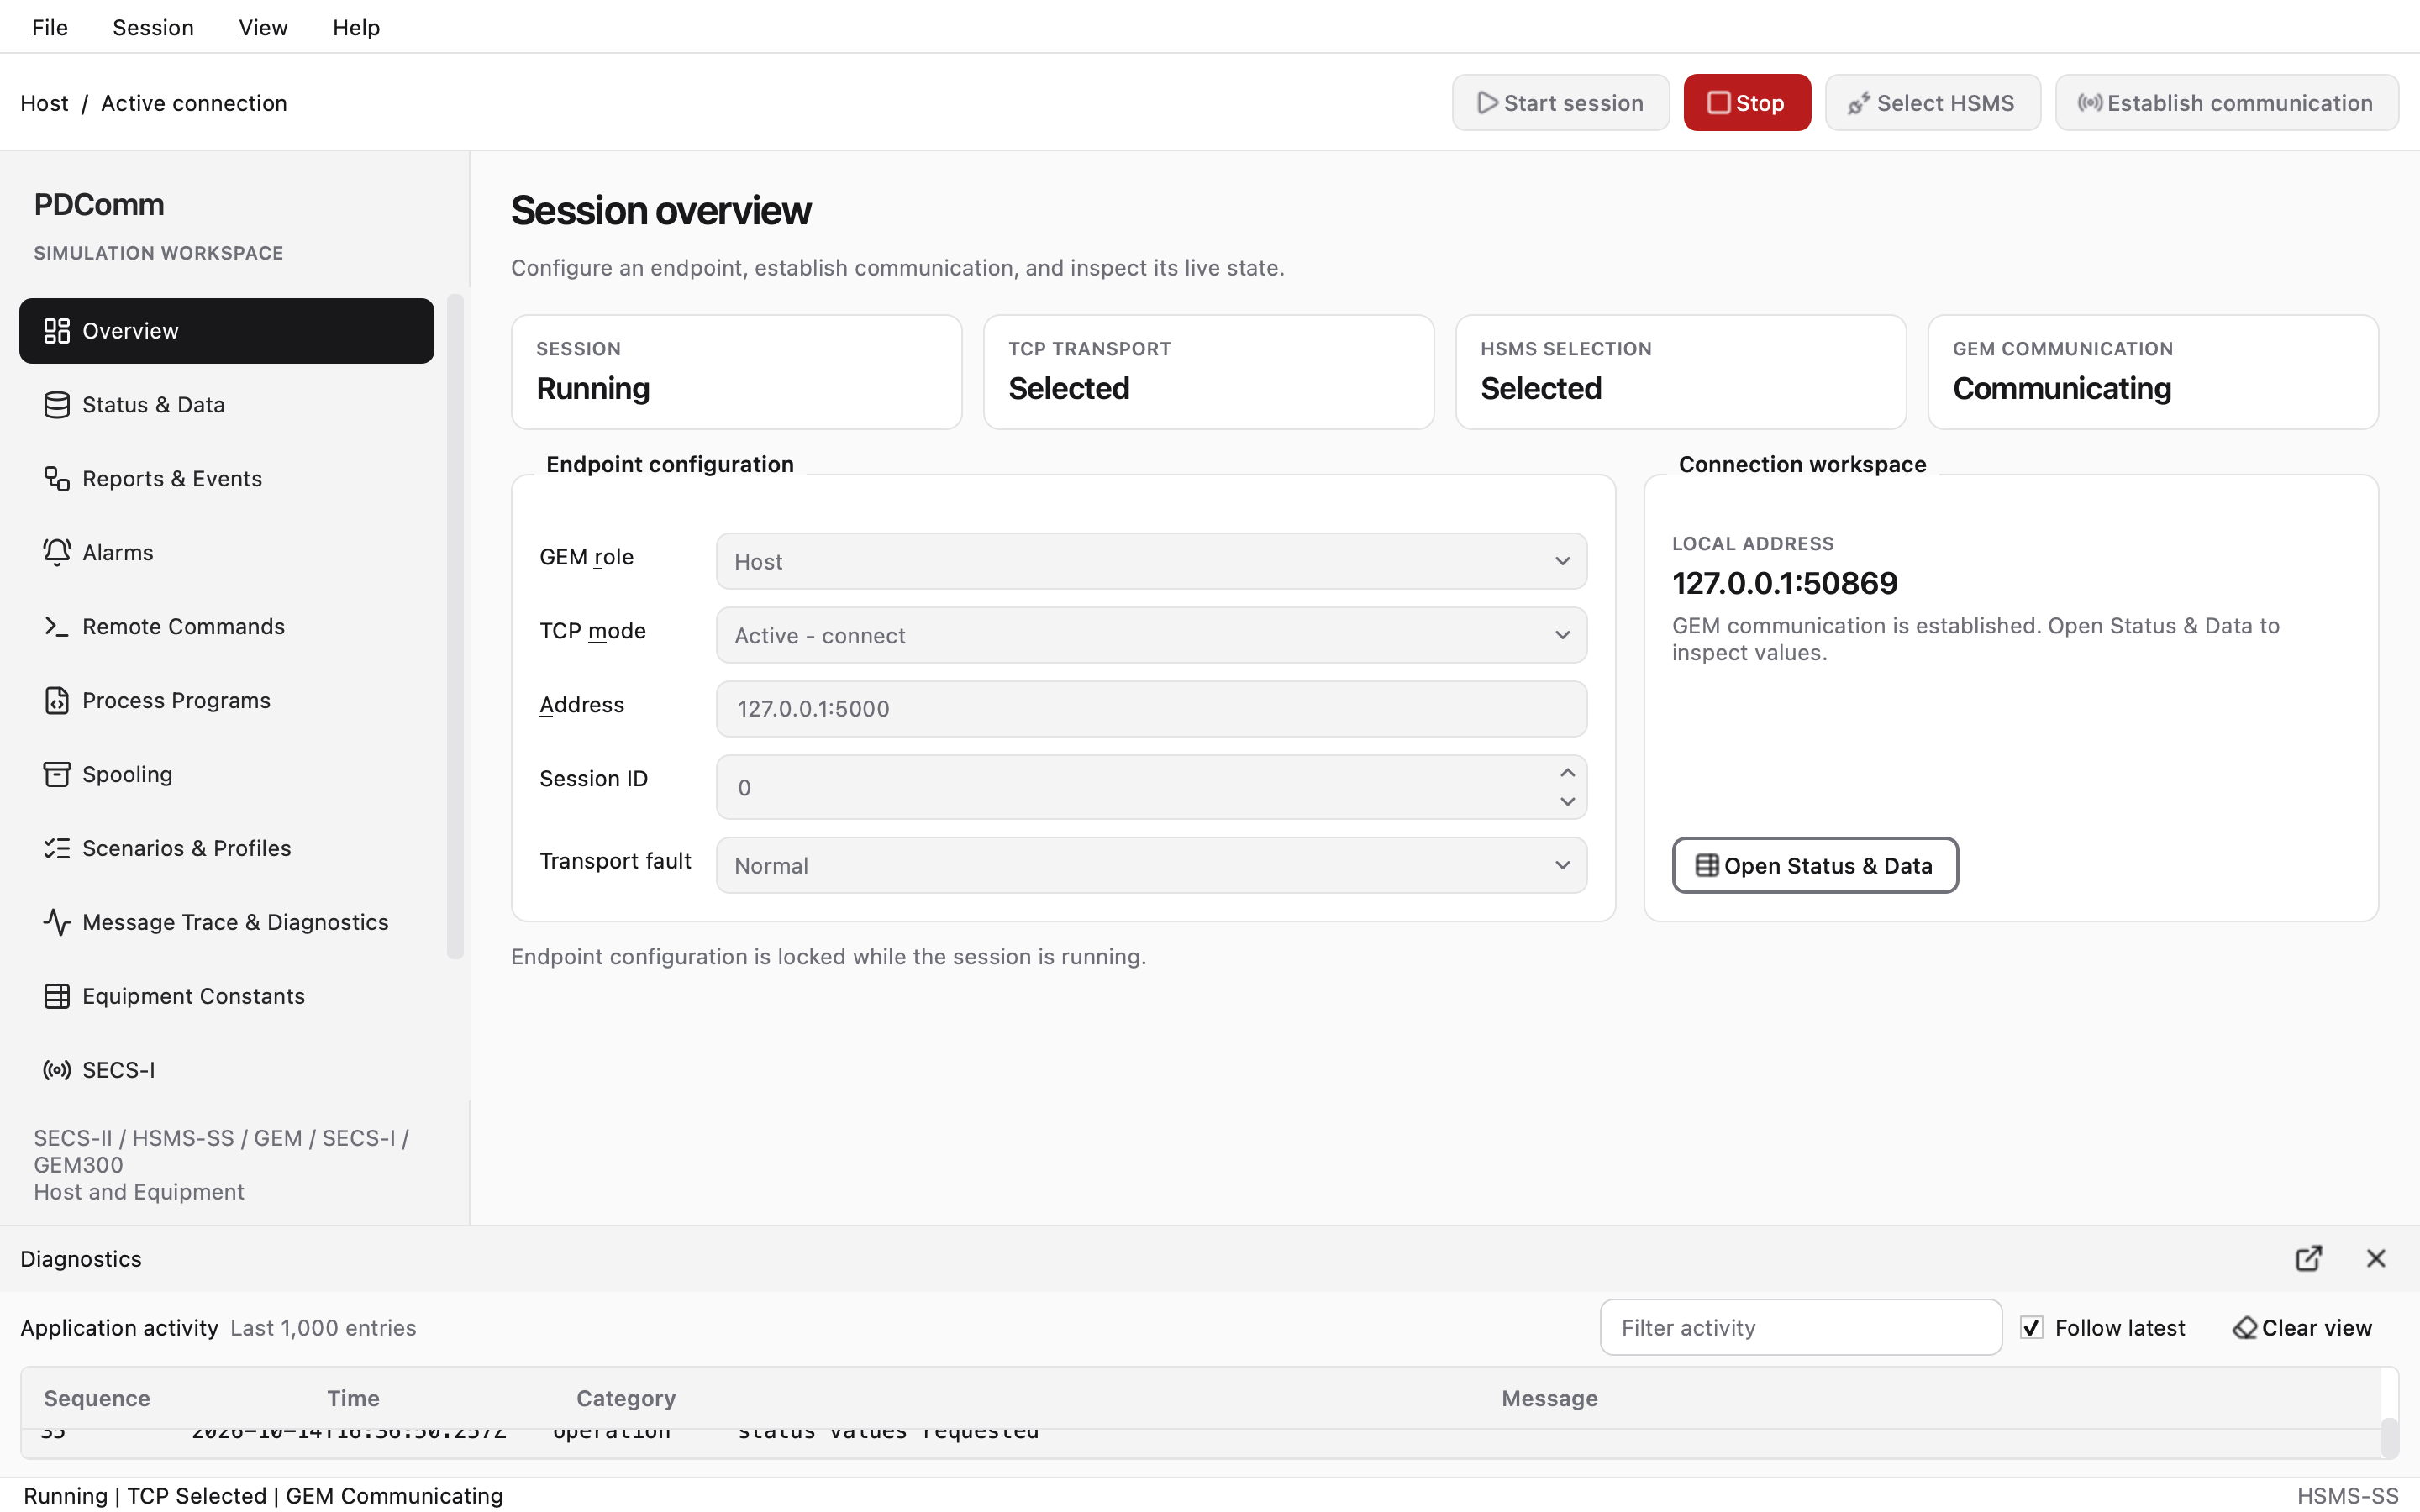
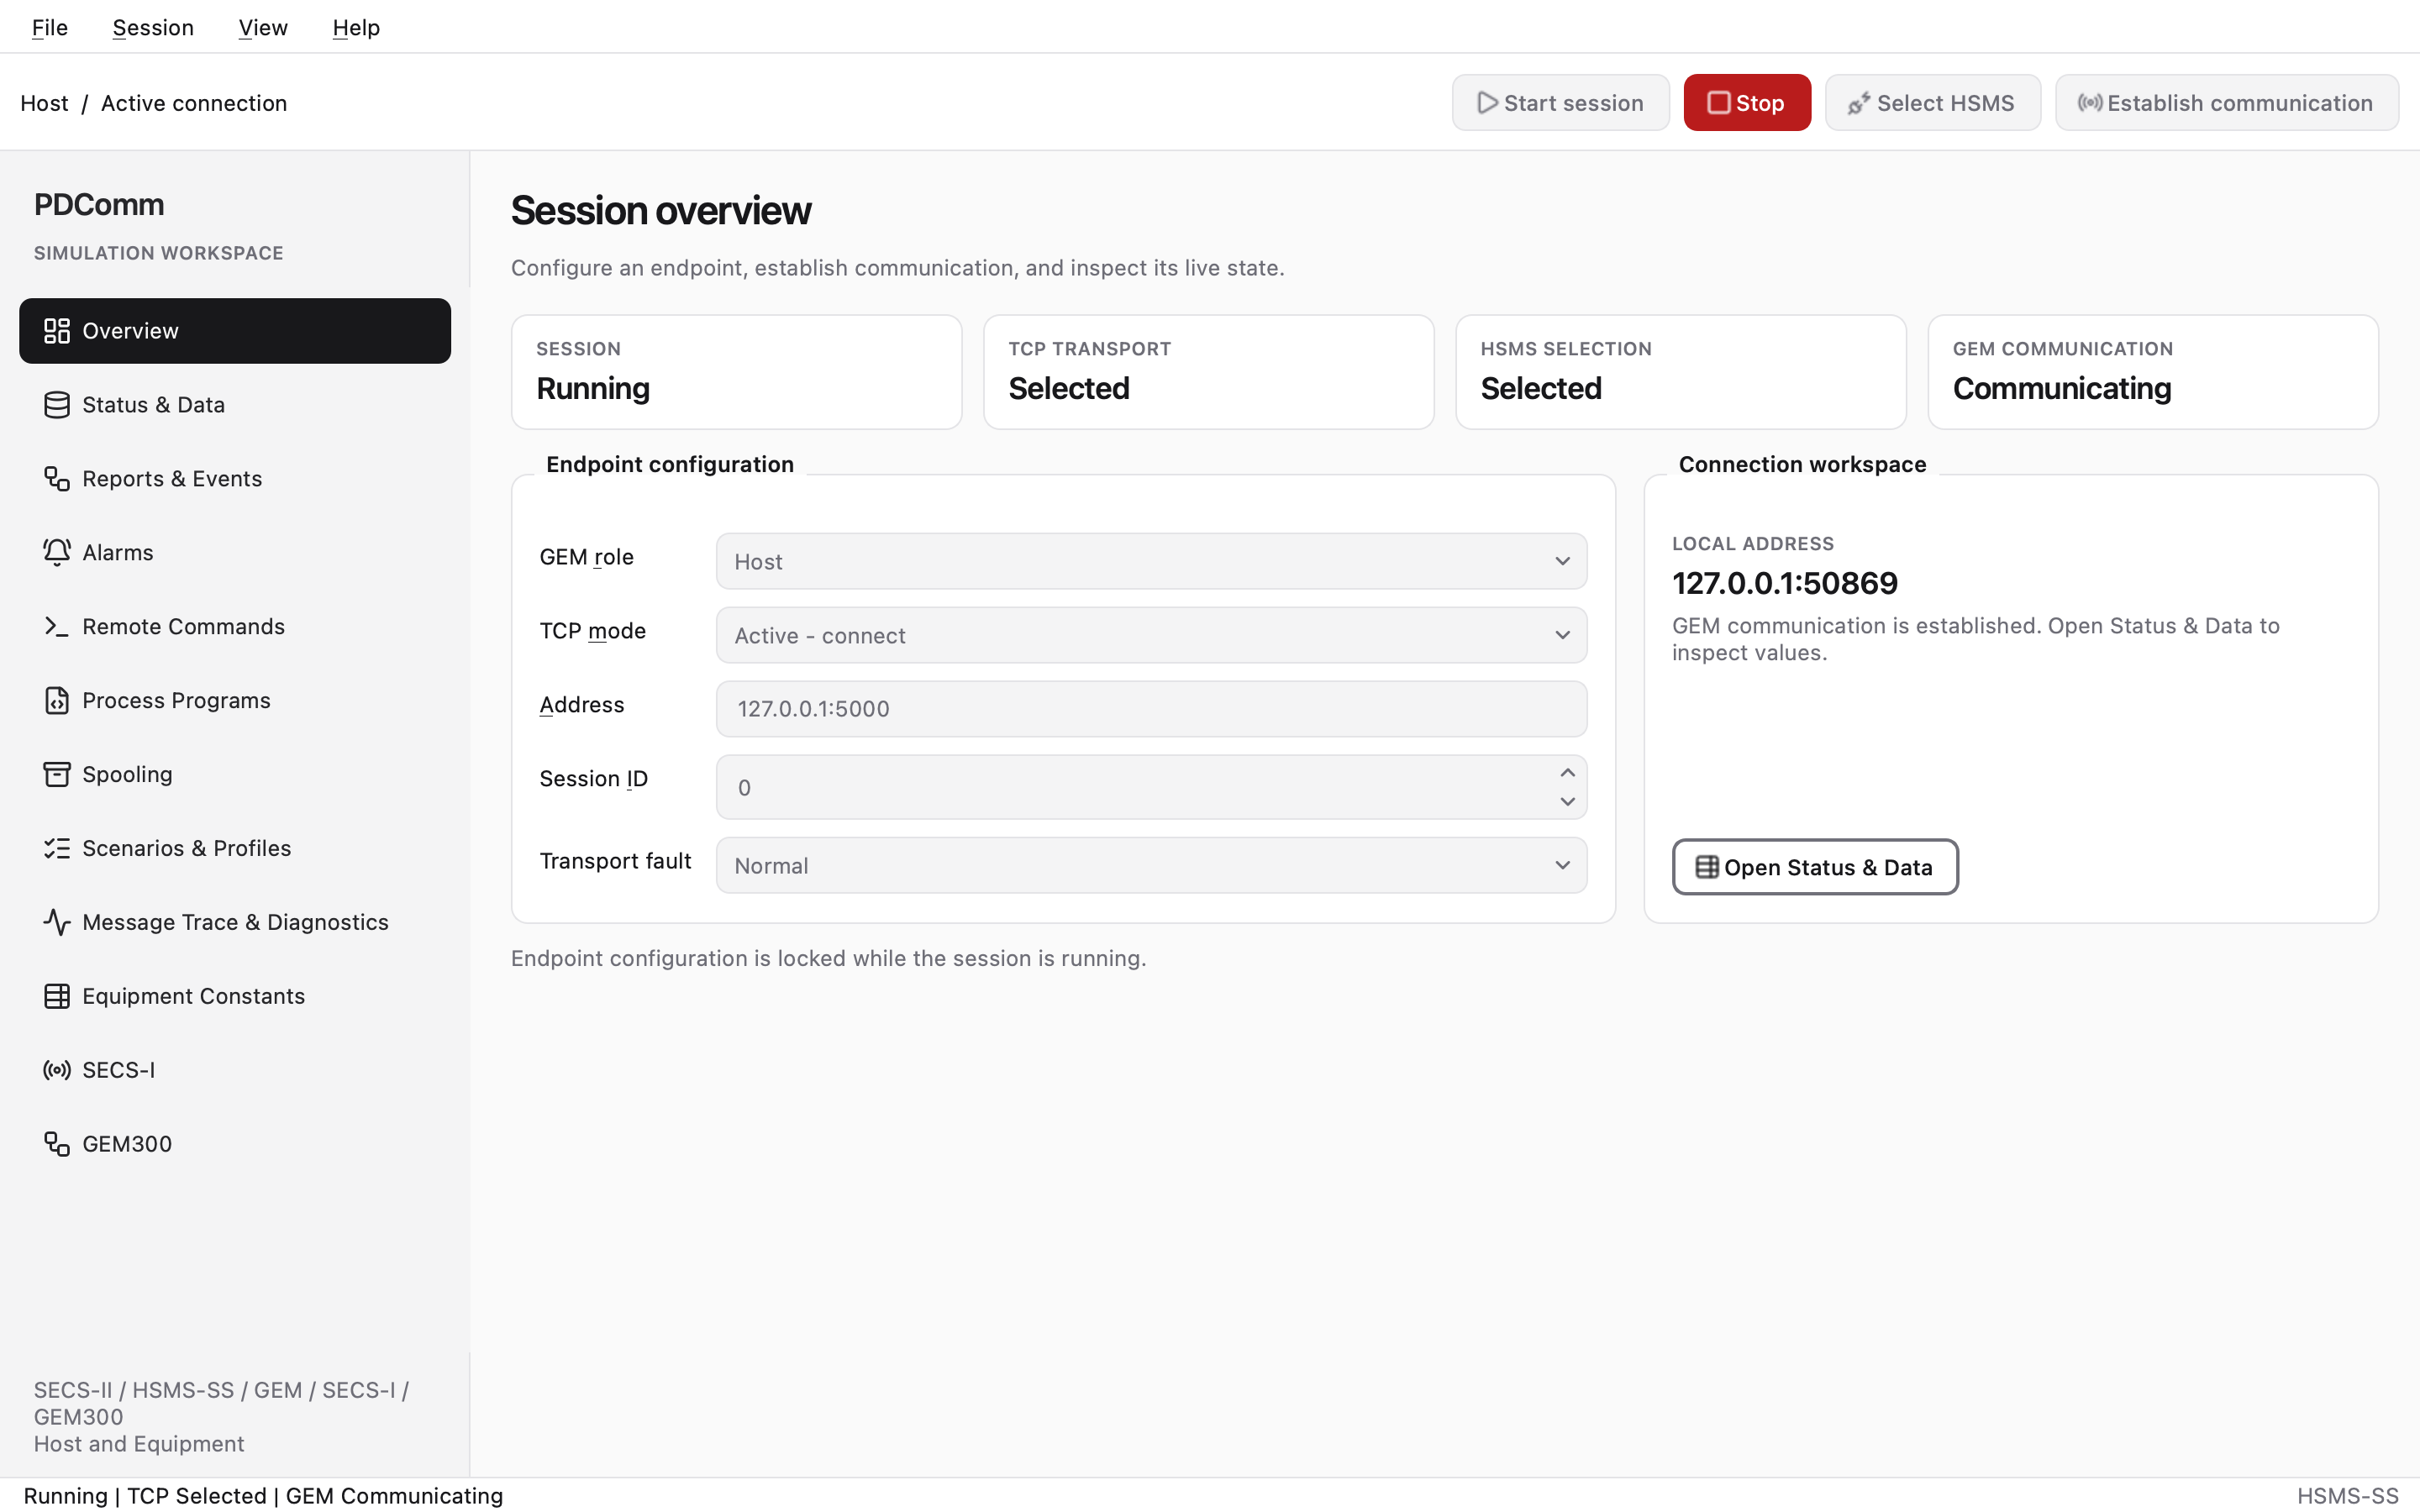
Section titled “Window layout”+-------------------+---------------------------------------------------------------+| PDComm | Session toolbar: Host / Active connection || SIMULATION | [Start session] [Stop] [Select HSMS] [Establish communication]|| WORKSPACE +---------------------------------------------------------------+| | || Overview | selected workspace || Status & Data | || Reports & Events | || ... (12 items) +---------------------------------------------------------------+| | Diagnostics dock (Application activity) |+-------------------+---------------------------------------------------------------+| status bar: Running | TCP Selected | GEM Communicating HSMS-SS |+-----------------------------------------------------------------------------------+- Navigation list. Pick one of the 12 workspaces: Overview, Status & Data, Reports & Events, Alarms, Remote Commands, Process Programs, Spooling, Scenarios & Profiles, Message Trace & Diagnostics, Equipment Constants, SECS-I, and GEM300.
- Session toolbar. The left side shows the role and connection style, for example
Host / Active connection. The buttons on the right are:- Start session (F5) starts the endpoint with the configured role, address, and session ID.
- Stop (Shift+F5) stops the endpoint and drains its shutdown events. While a stopped session is retained, the button turns into End session, which destroys the session and unlocks the endpoint and next-start settings.
- Select HSMS requests HSMS selection when TCP is connected but not selected (
NotSelected). - Establish communication is available for the Host role only. It sends S1F13 when HSMS is selected and GEM is
NotCommunicating.
- Status bar. It starts as
Ready | No active session. Once a session runs, it shows all three states, for exampleRunning | TCP Selected | GEM Communicating.HSMS-SSis always shown on the right. - Diagnostics dock. The Application activity table at the bottom keeps the last 1,000 entries in the Sequence, Time, Category, and Message columns. Narrow it with Filter activity, keep the newest row in view with Follow latest, and empty it with Clear view. If you close the dock, reopen it with View > Diagnostics.
The menu bar is drawn inside the window on every operating system.
| Menu | Items |
|---|---|
| File | Open Project…, Save Project, Save Project As…, Open Trace…, Close Offline Trace, Export Trace…, Quit |
| Session | Start session (F5), Stop session (Shift+F5; End session while a stopped session is retained), Select HSMS, Establish communication |
| View | Session overview, Status & Data, Diagnostics, Appearance > Light / Dark |
| Help | About PDComm Simulator, Third-party notices |
About PDComm Simulator shows the version together with the secs-gem and gem300 license states and the host id. The simulator uses its embedded tool license, so you don’t install a license for it (see Install and check a license).
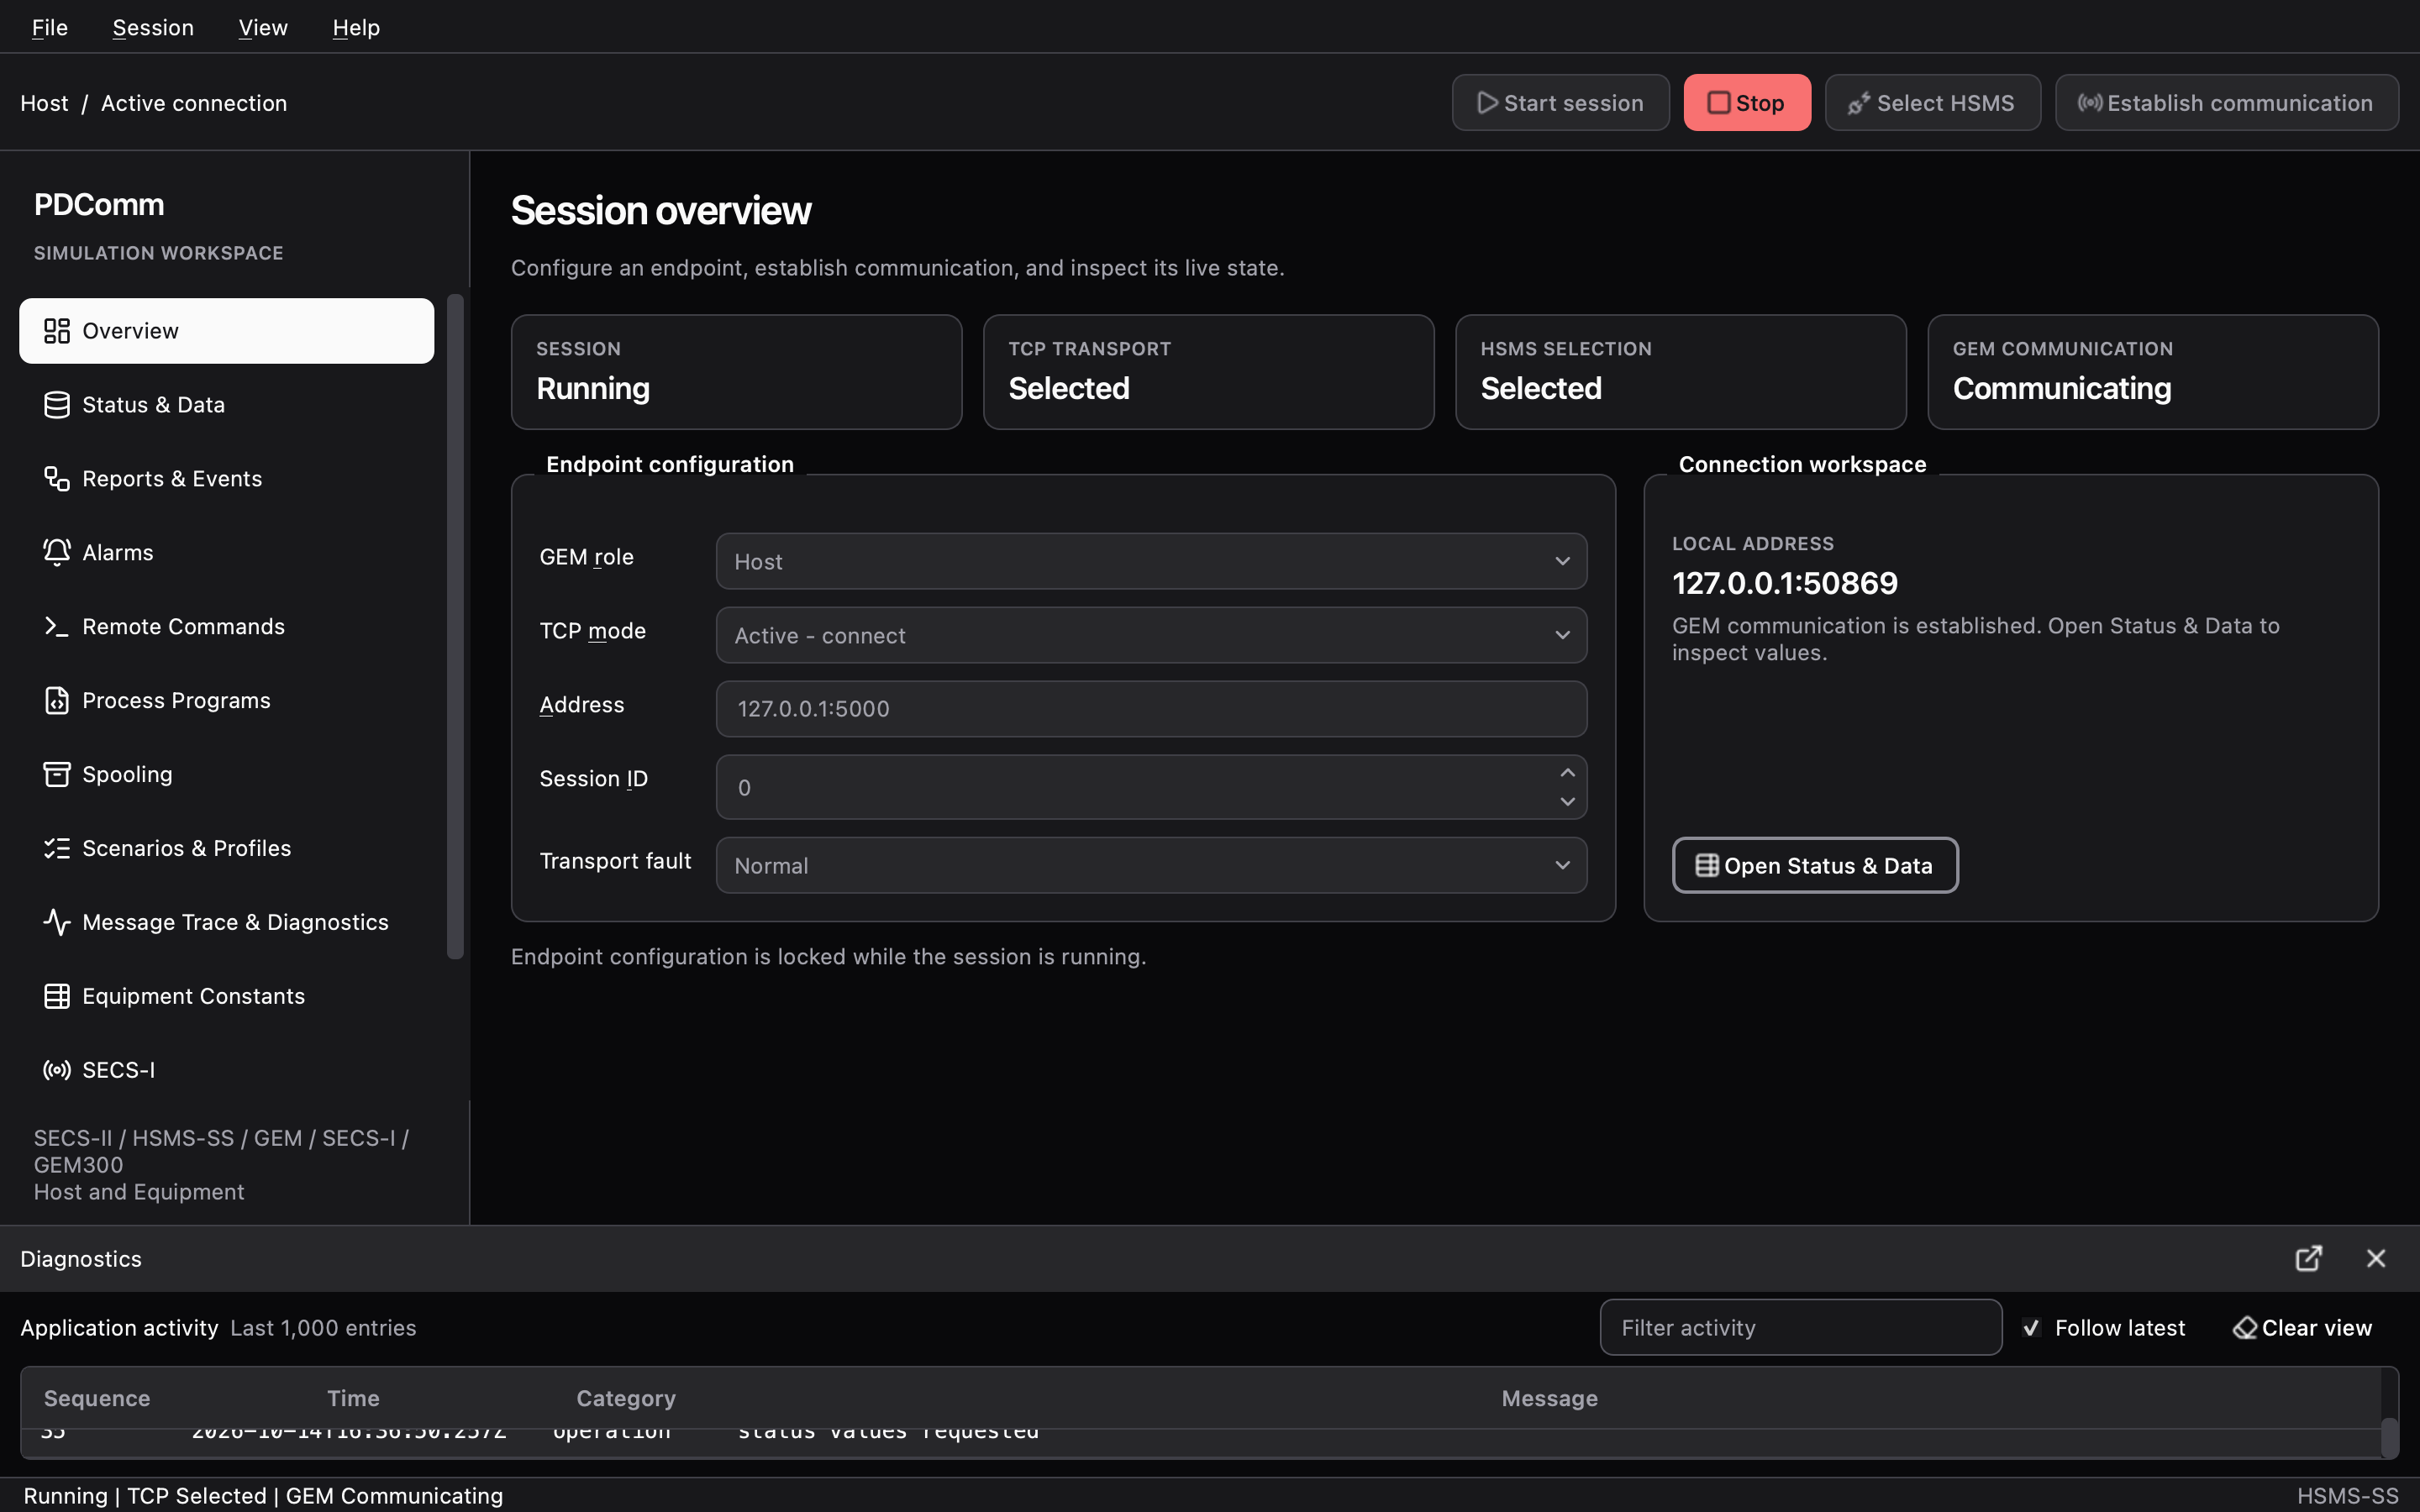
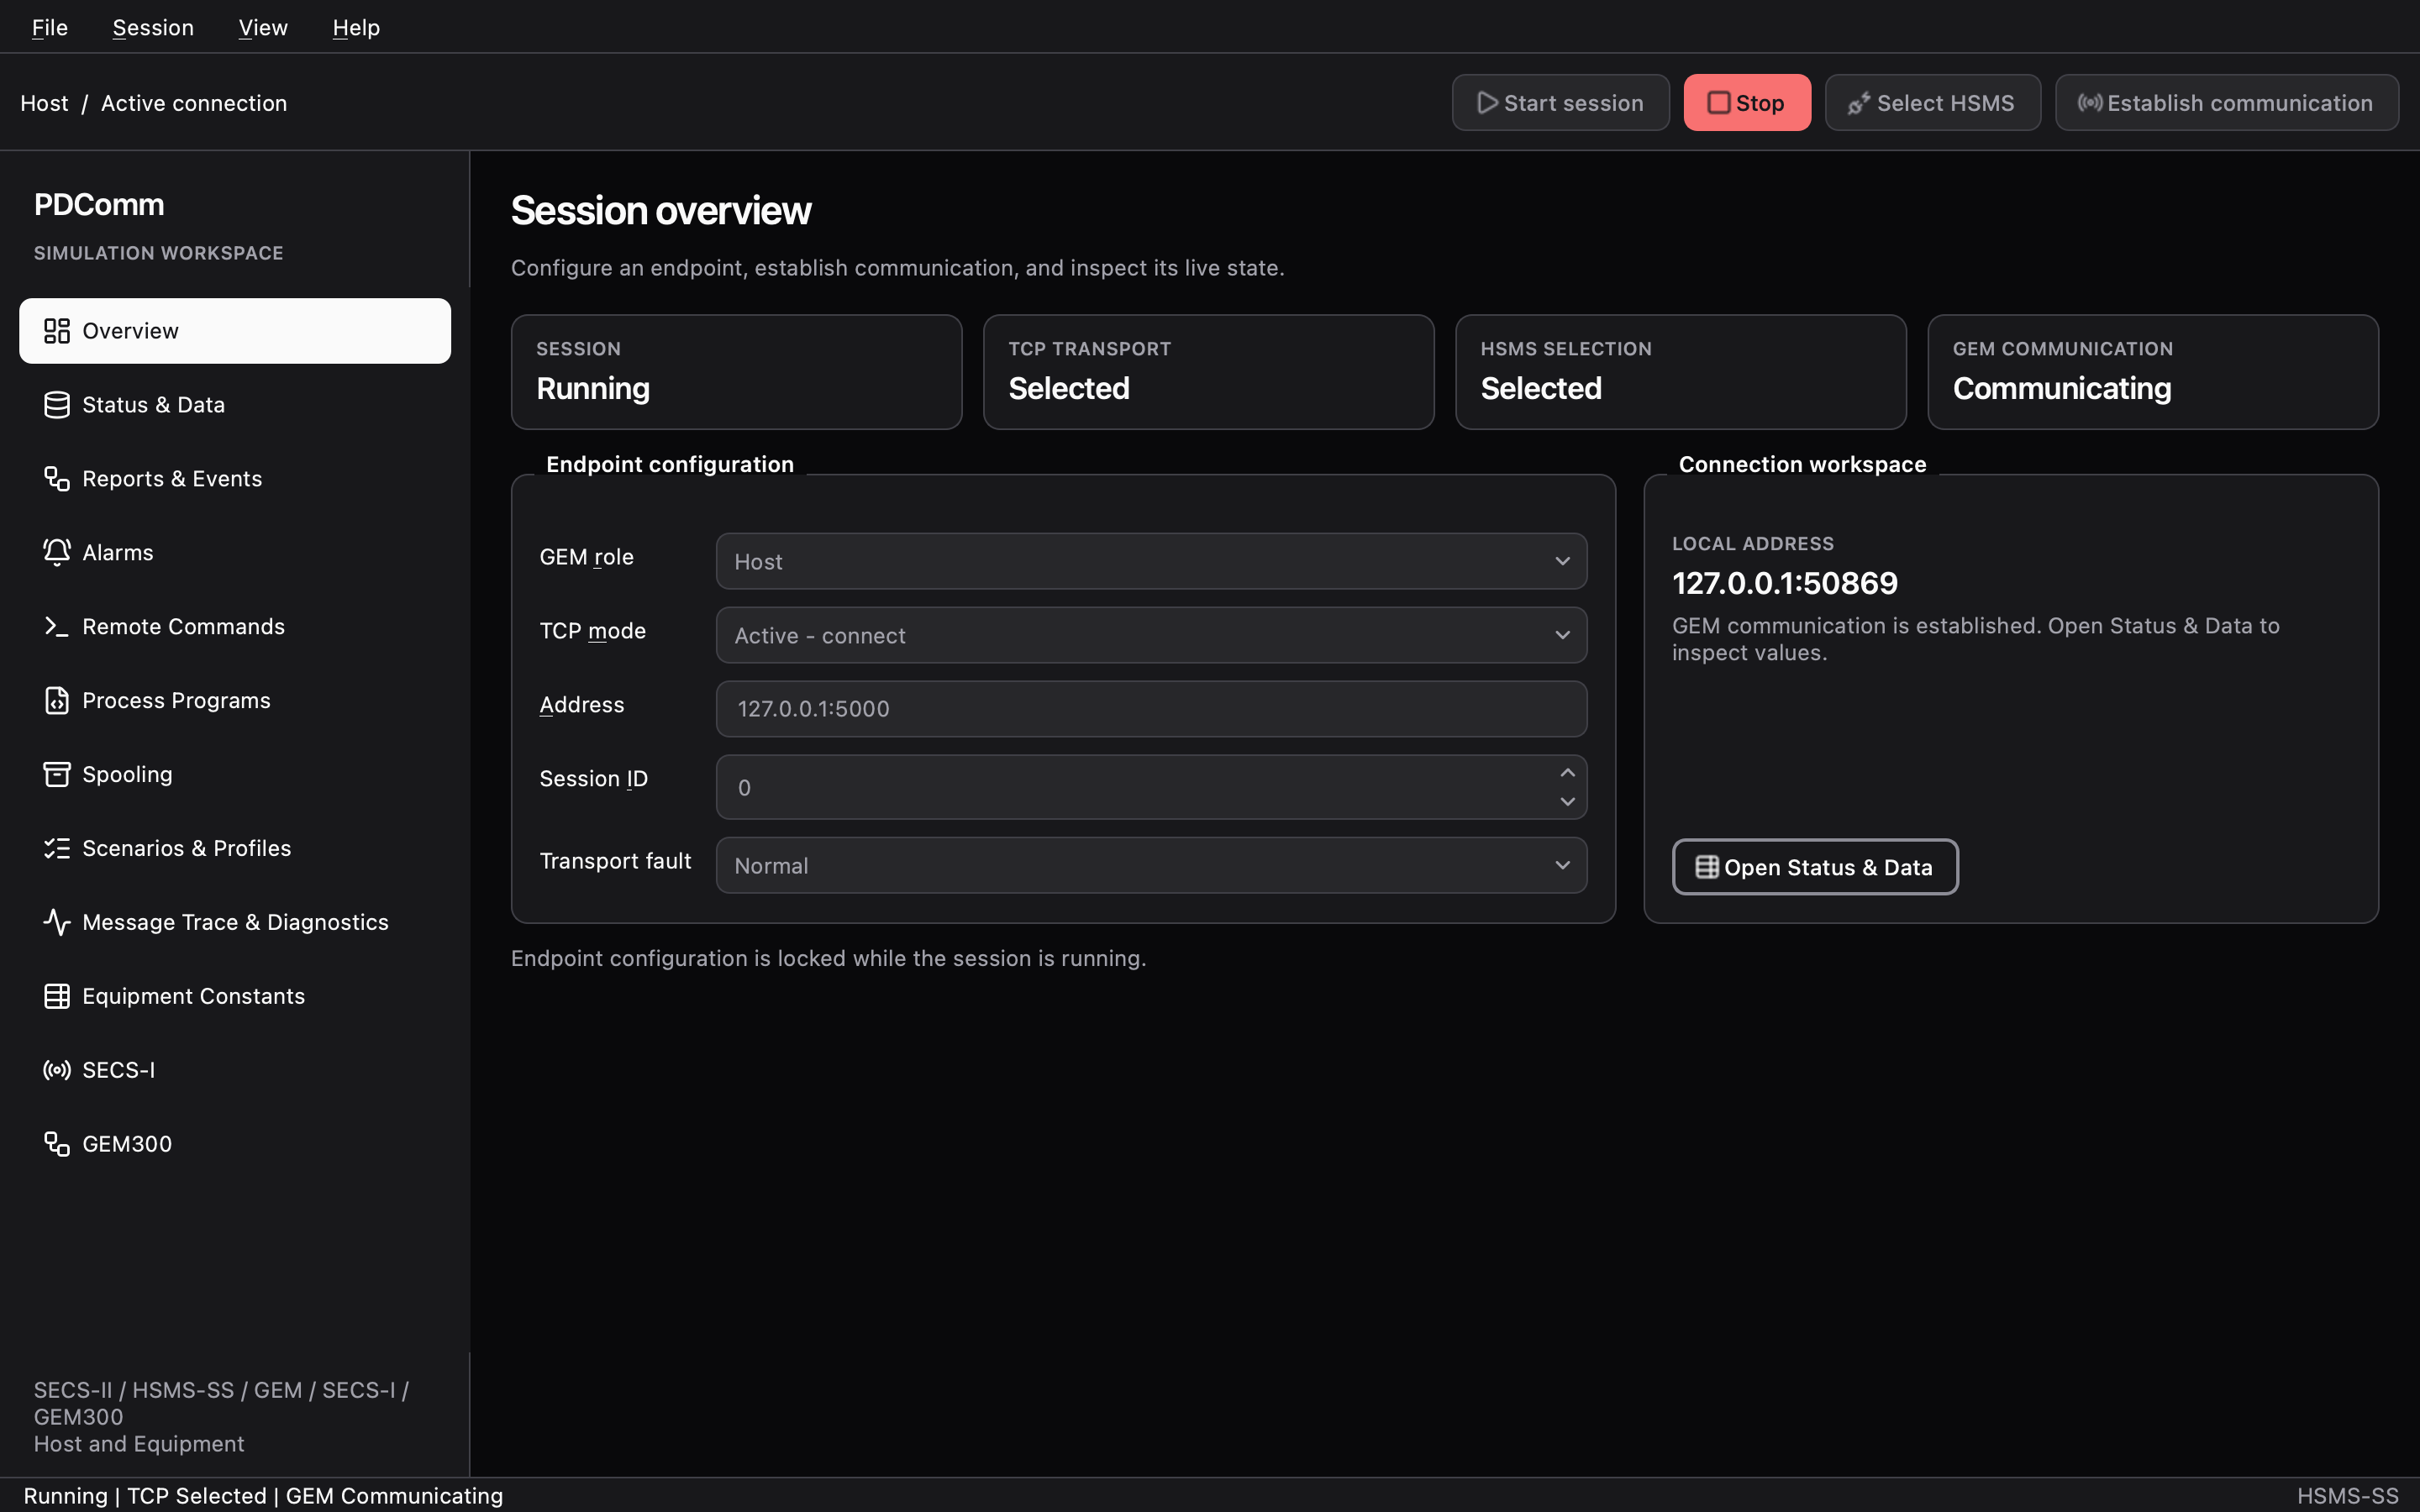
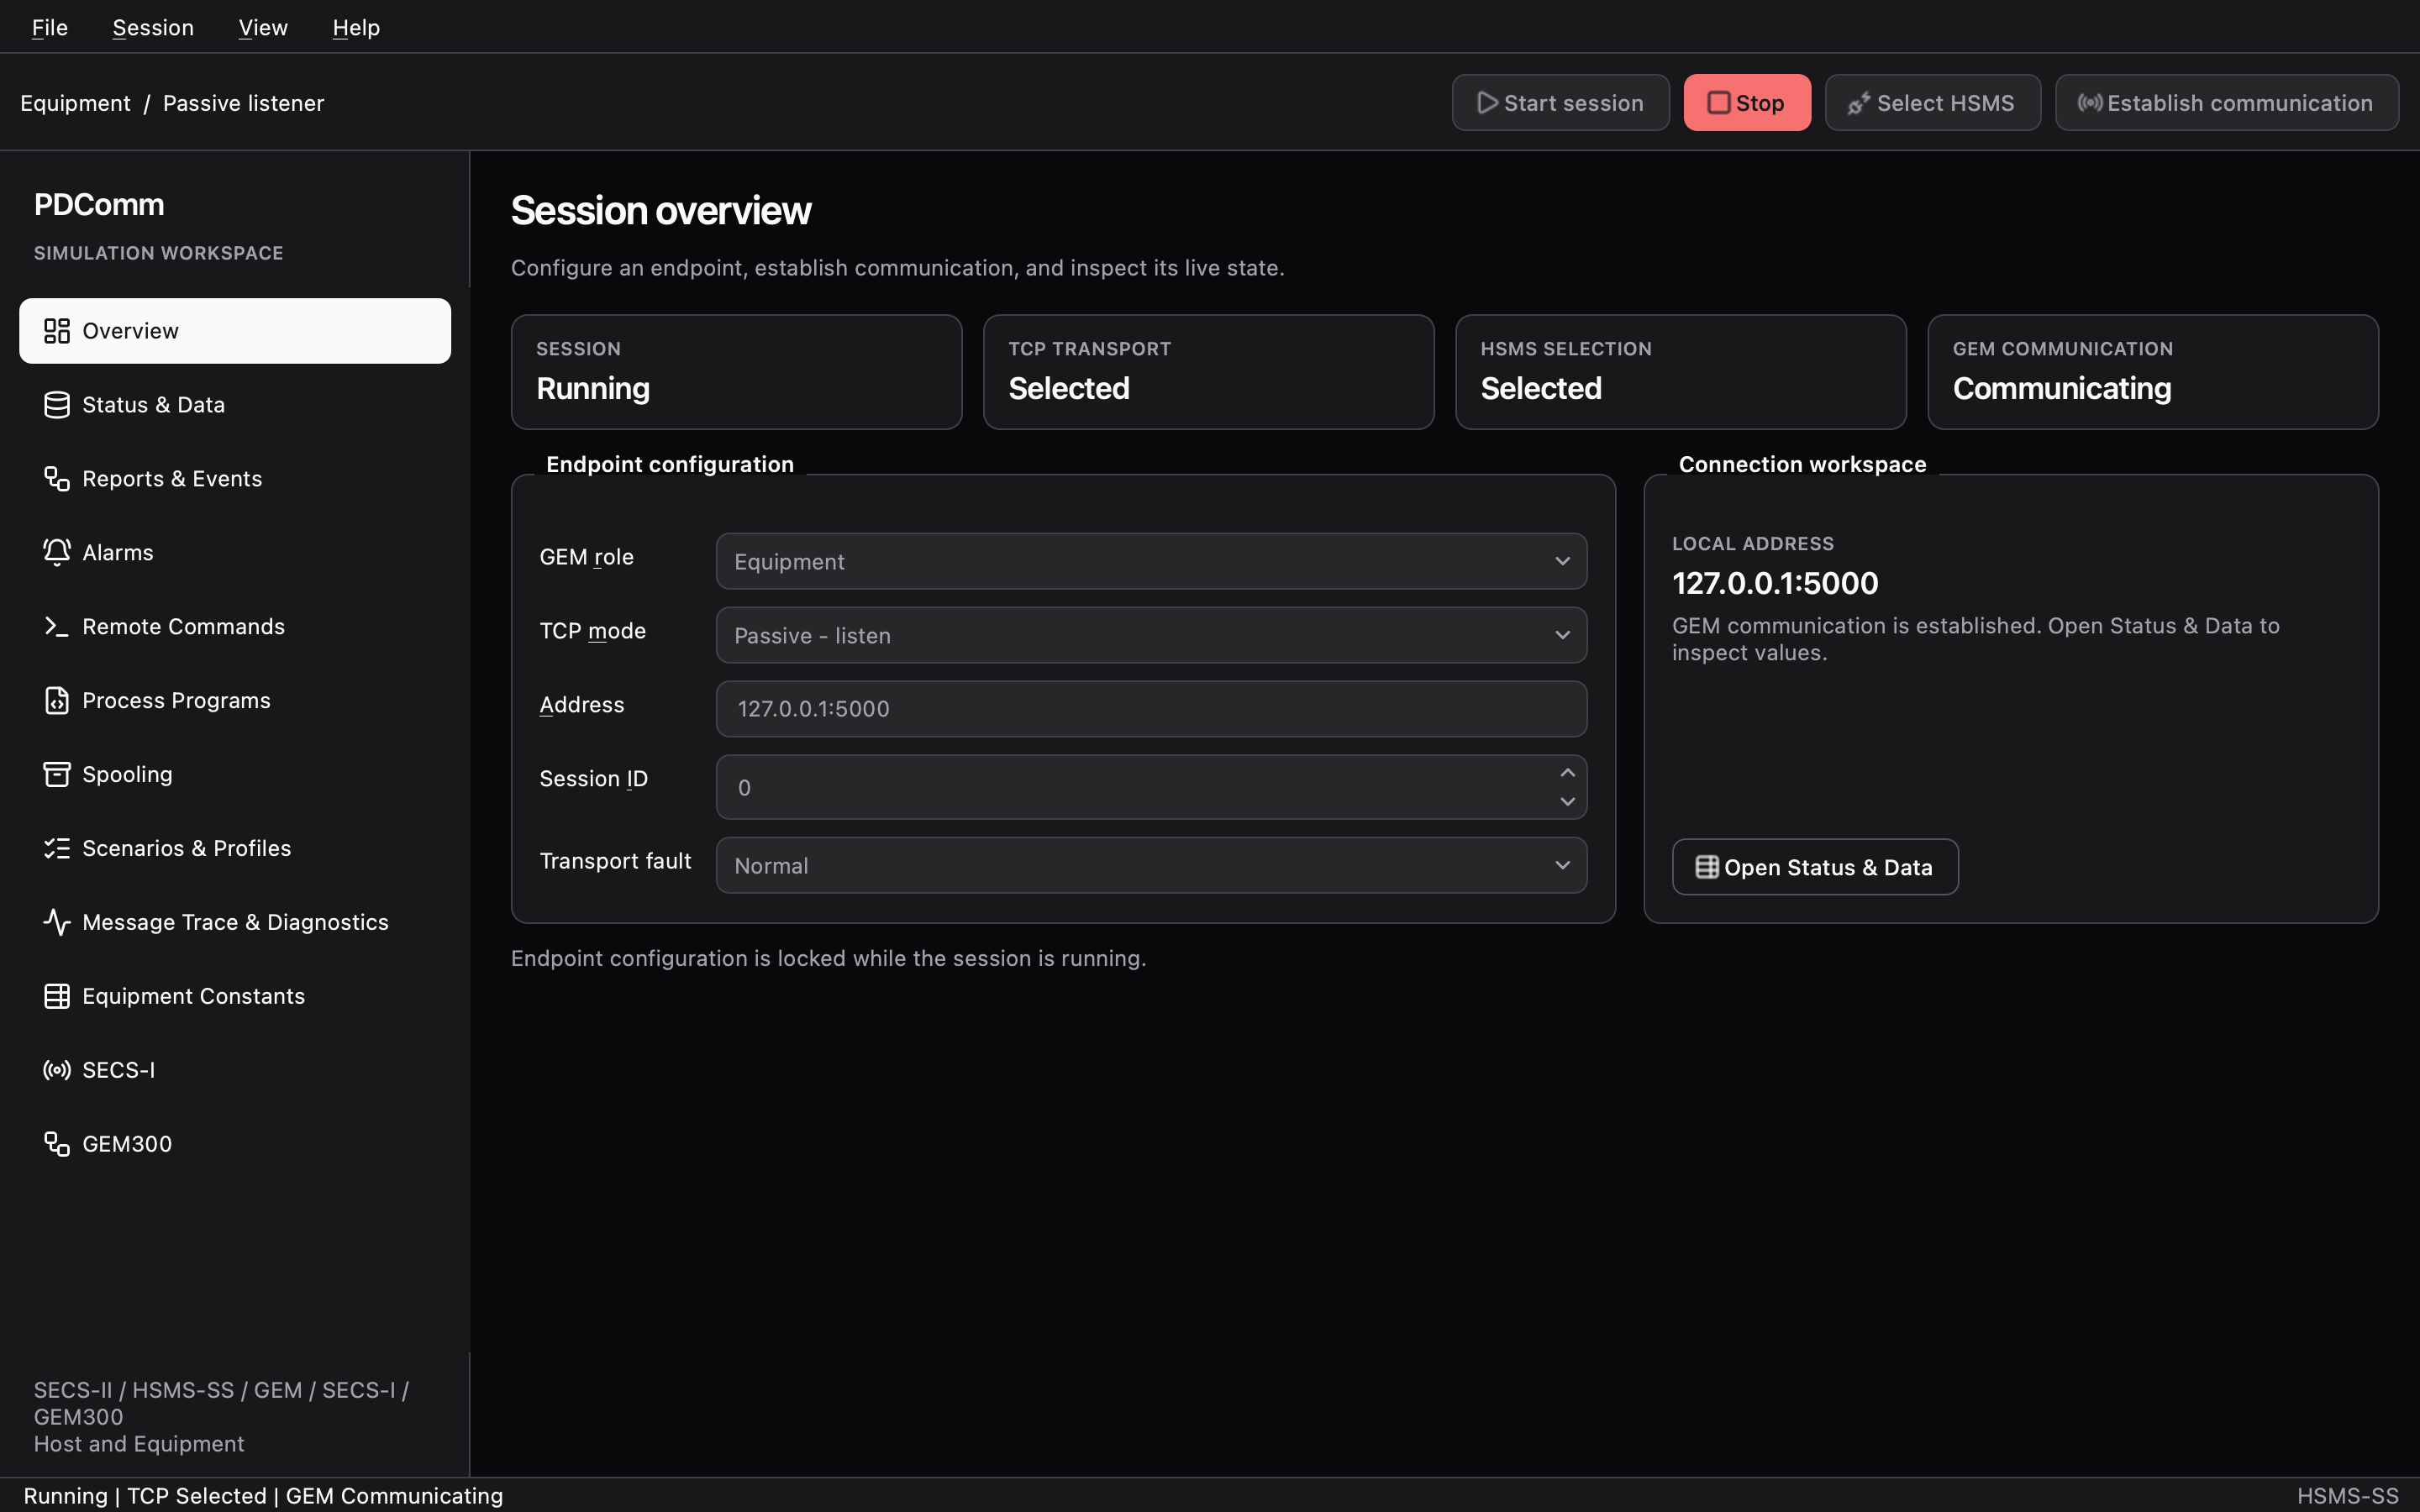
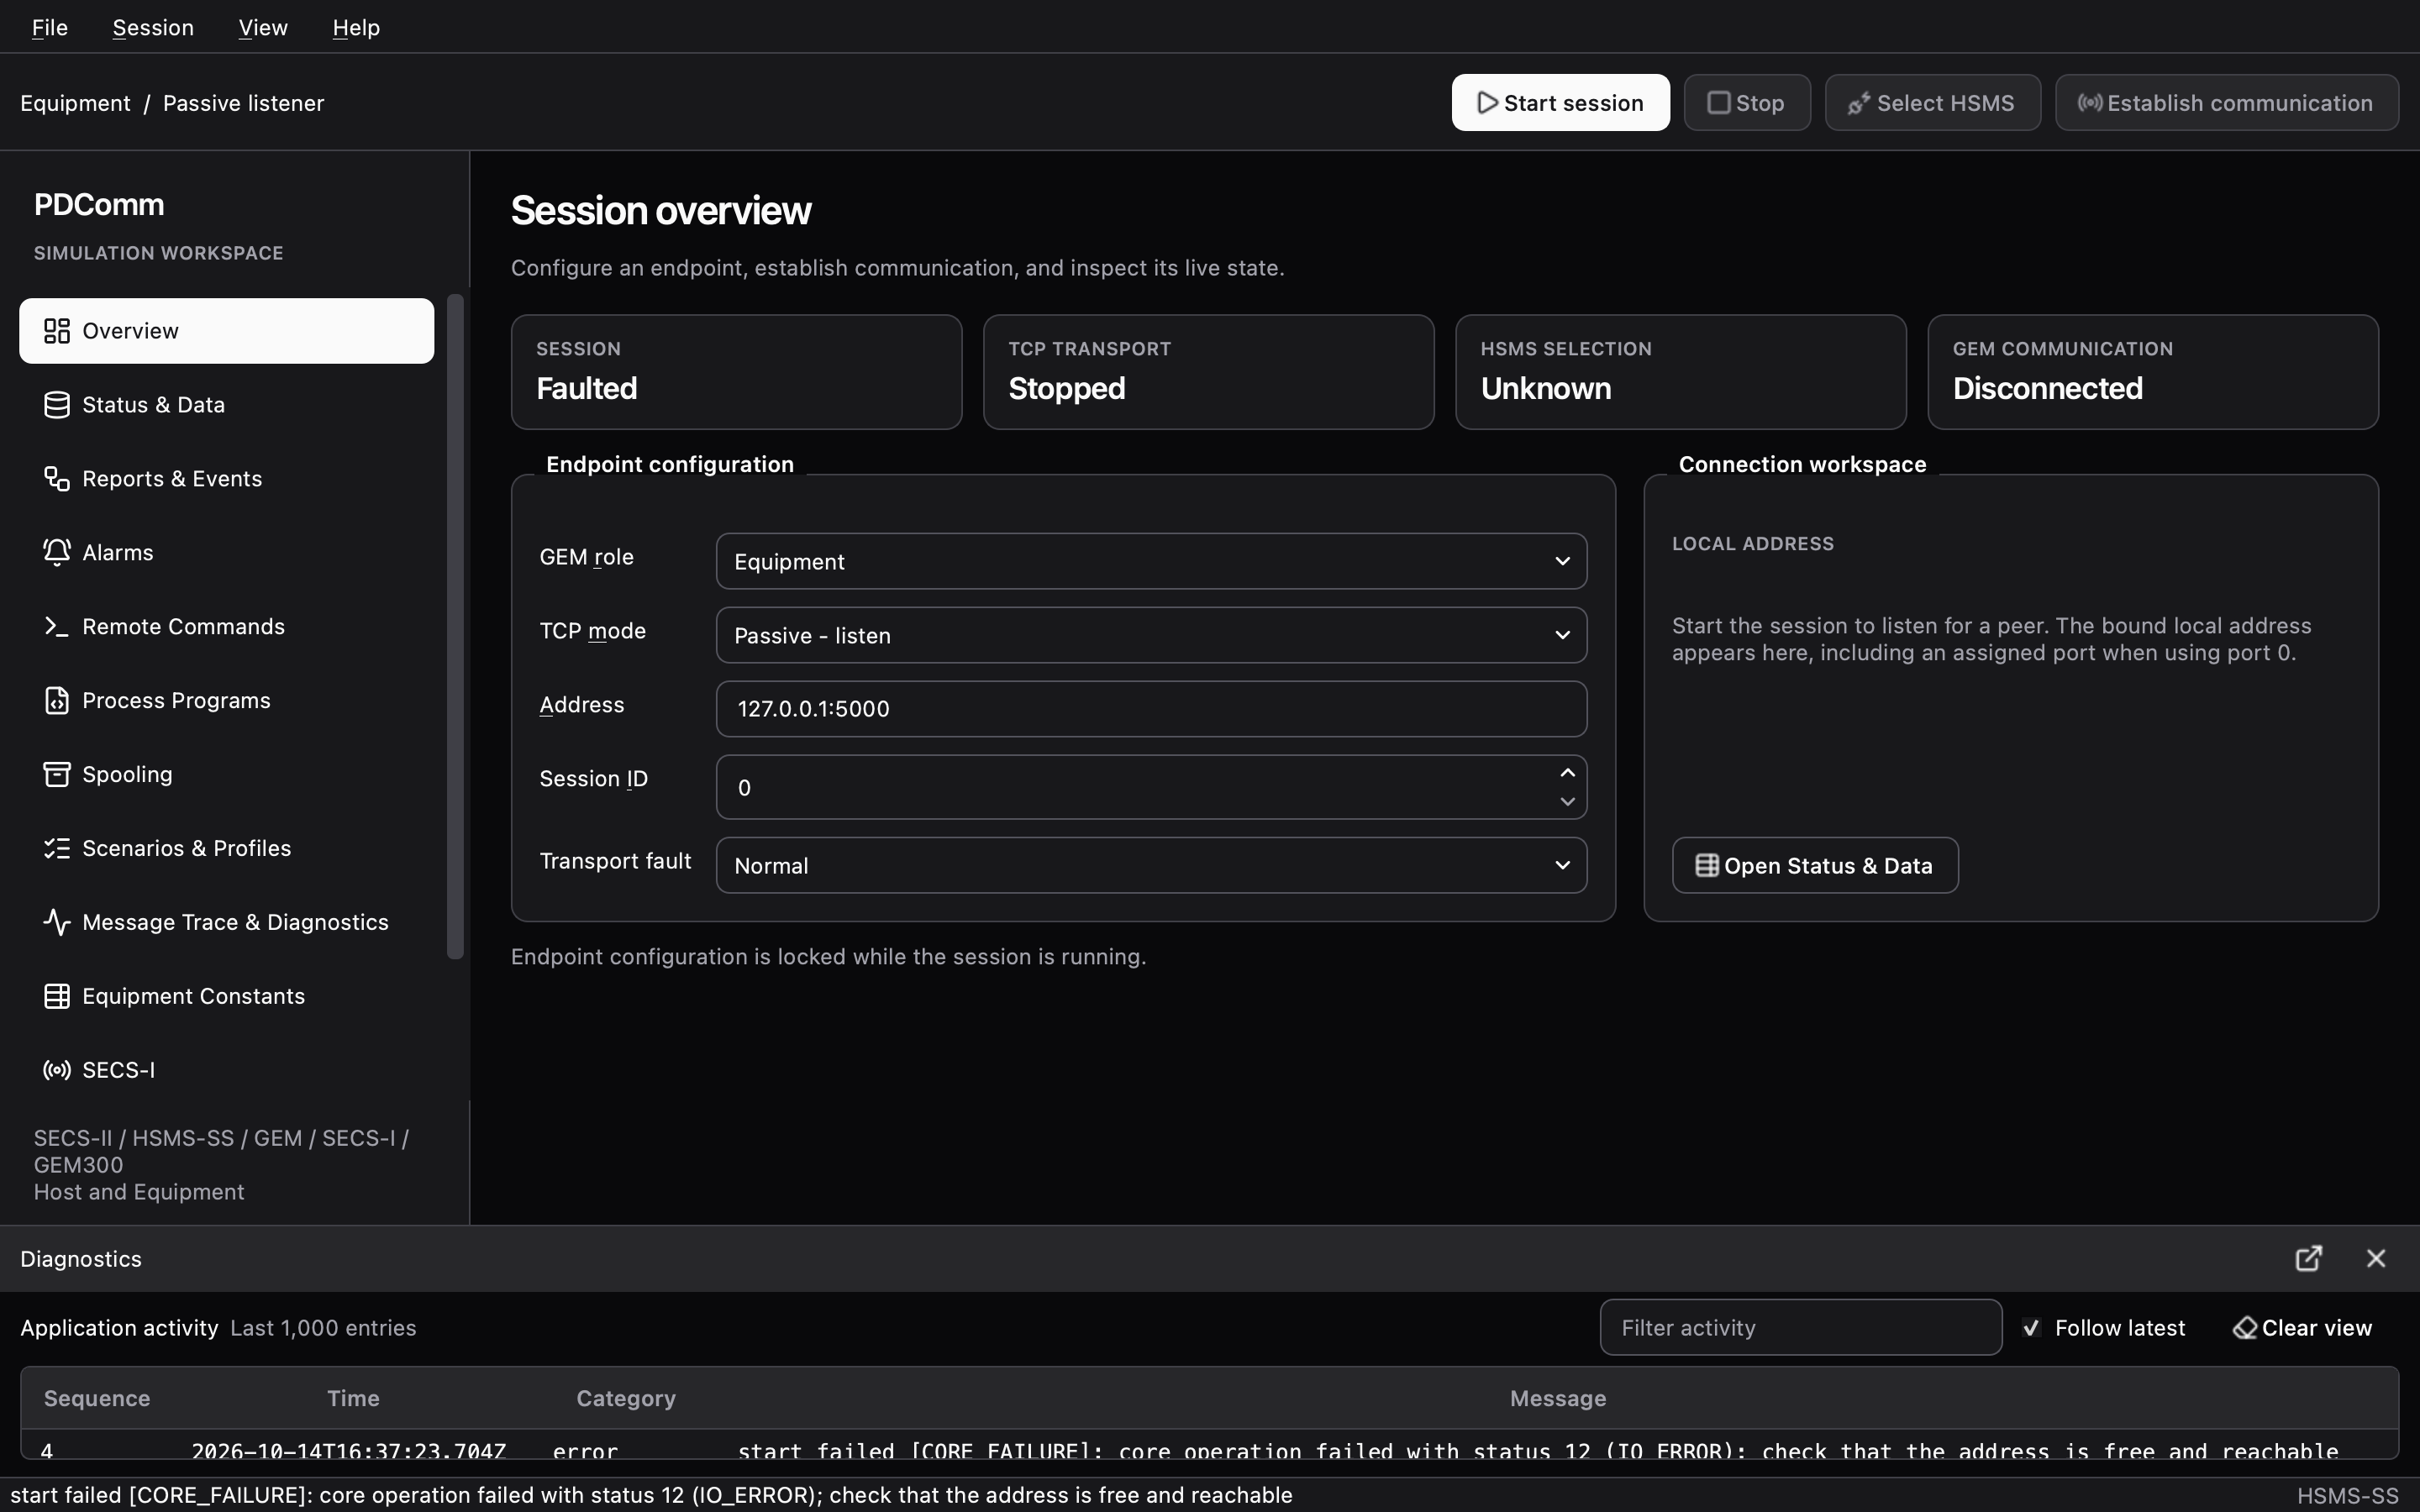
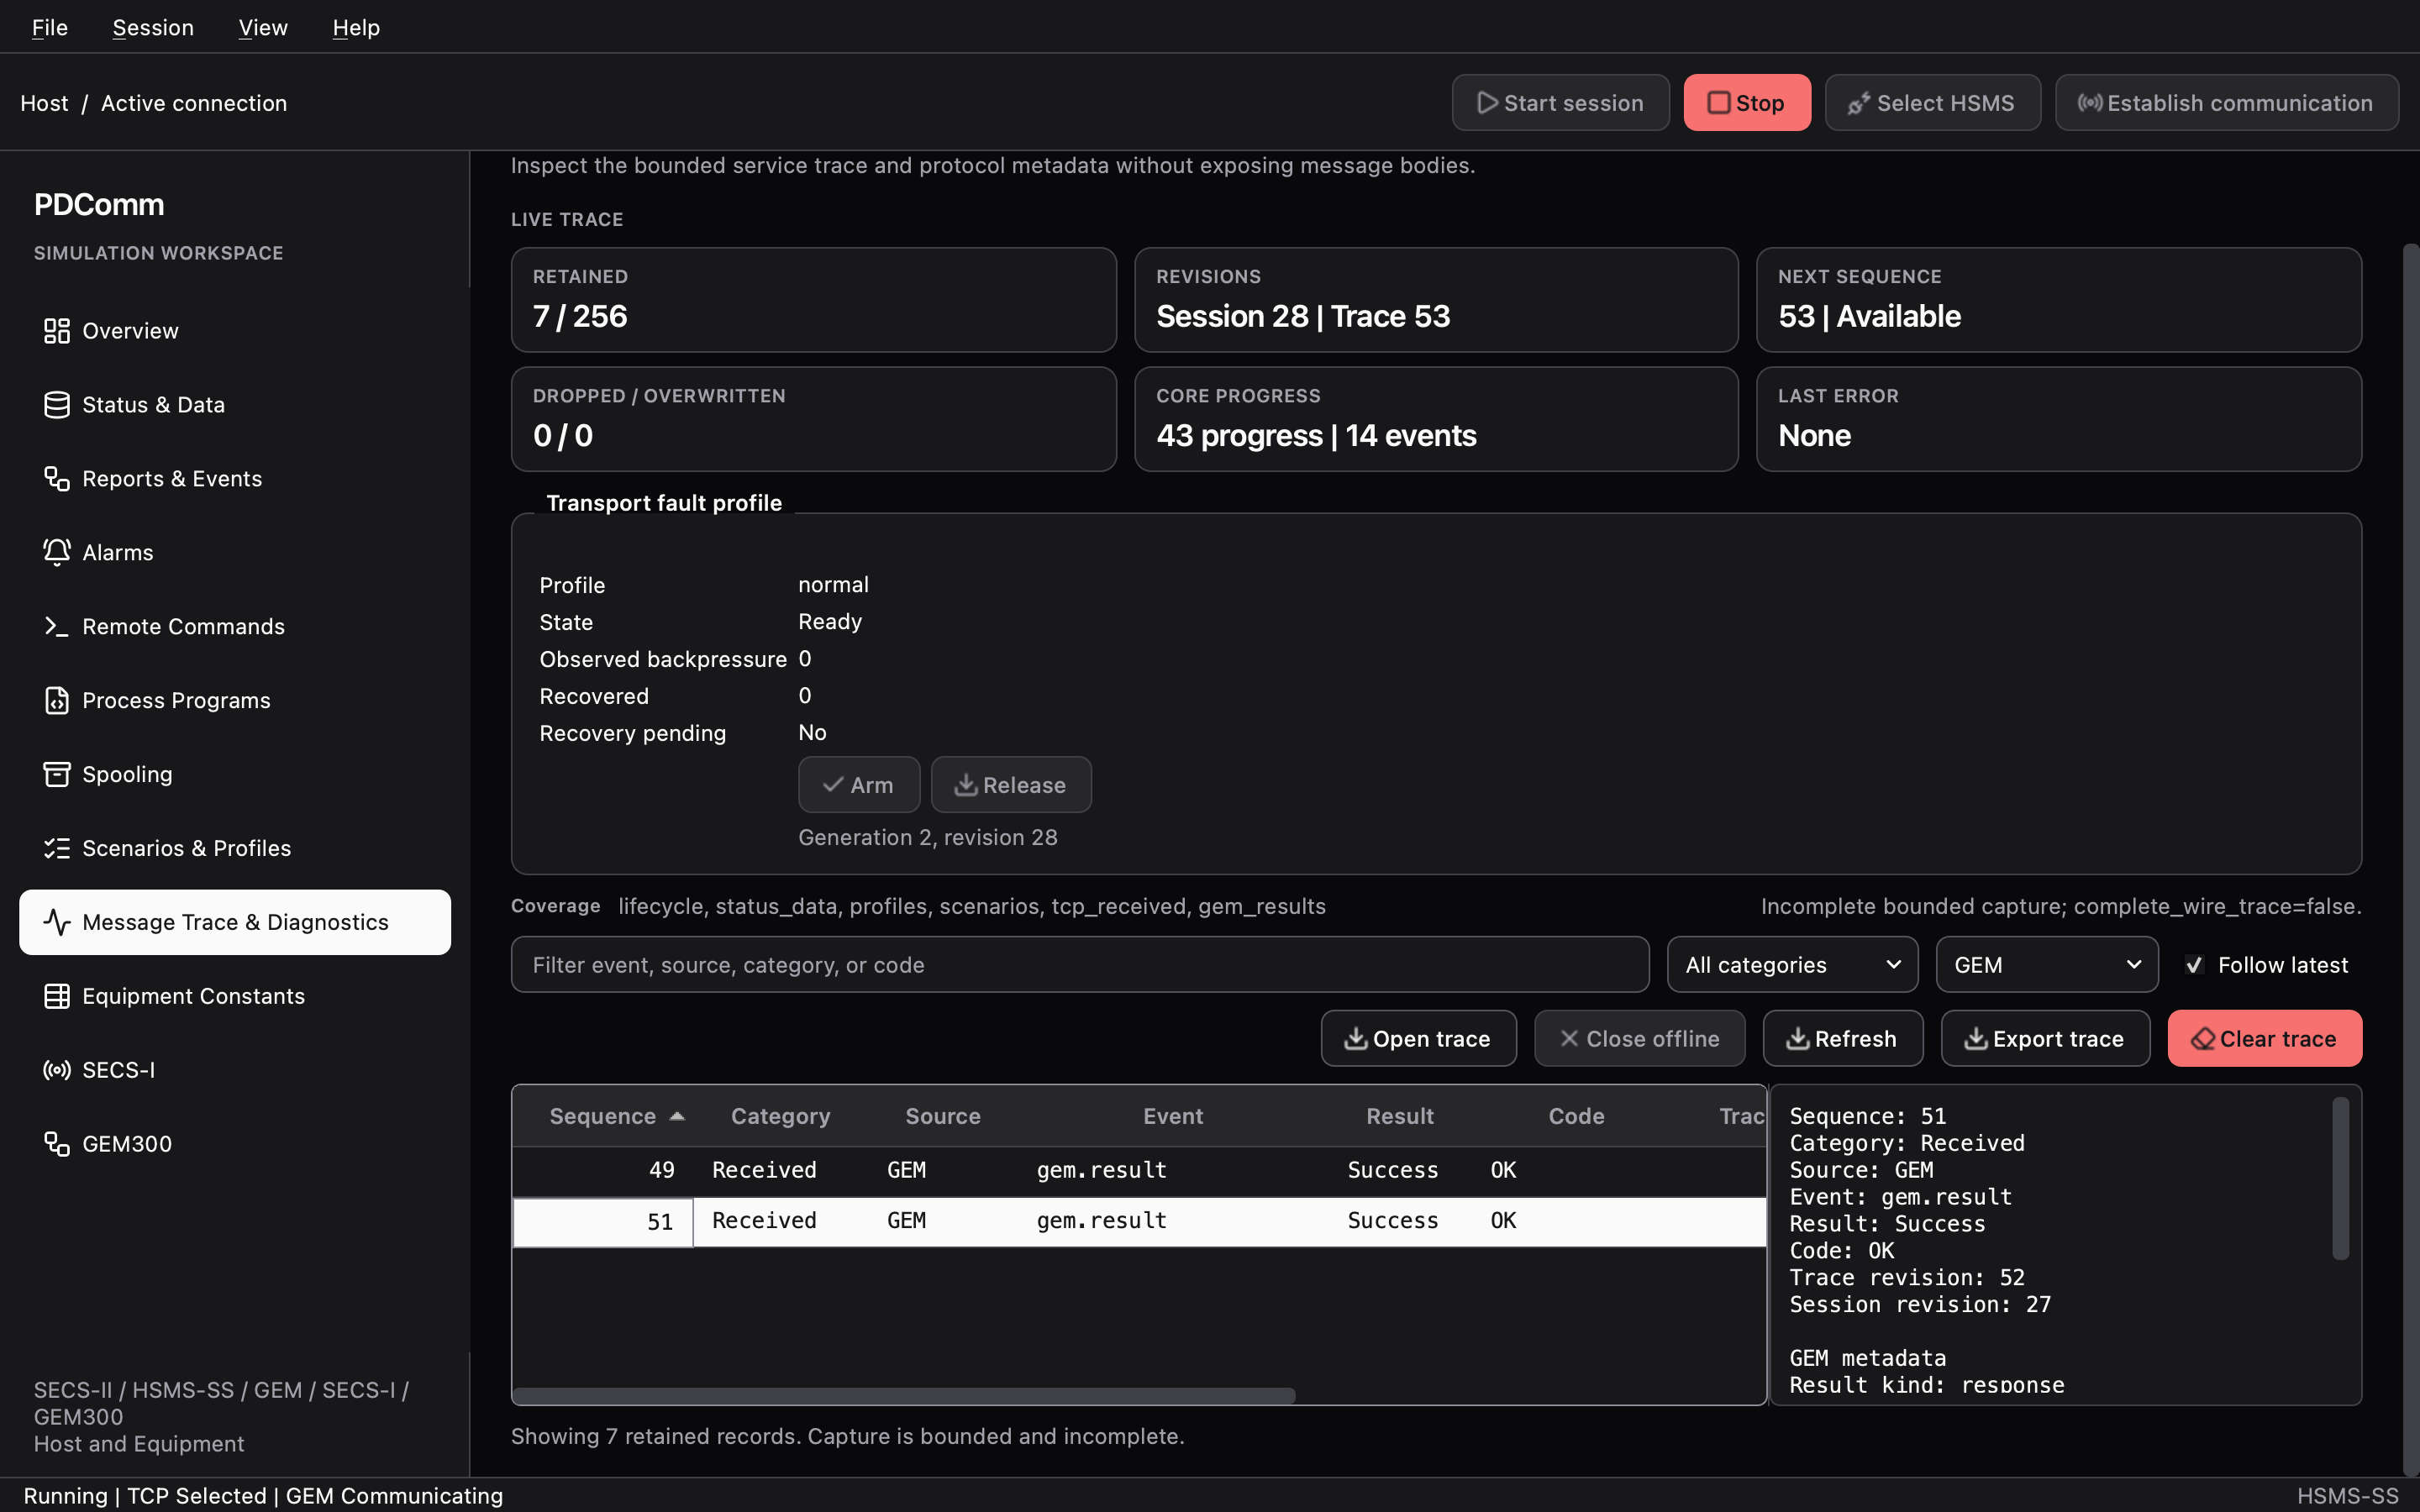
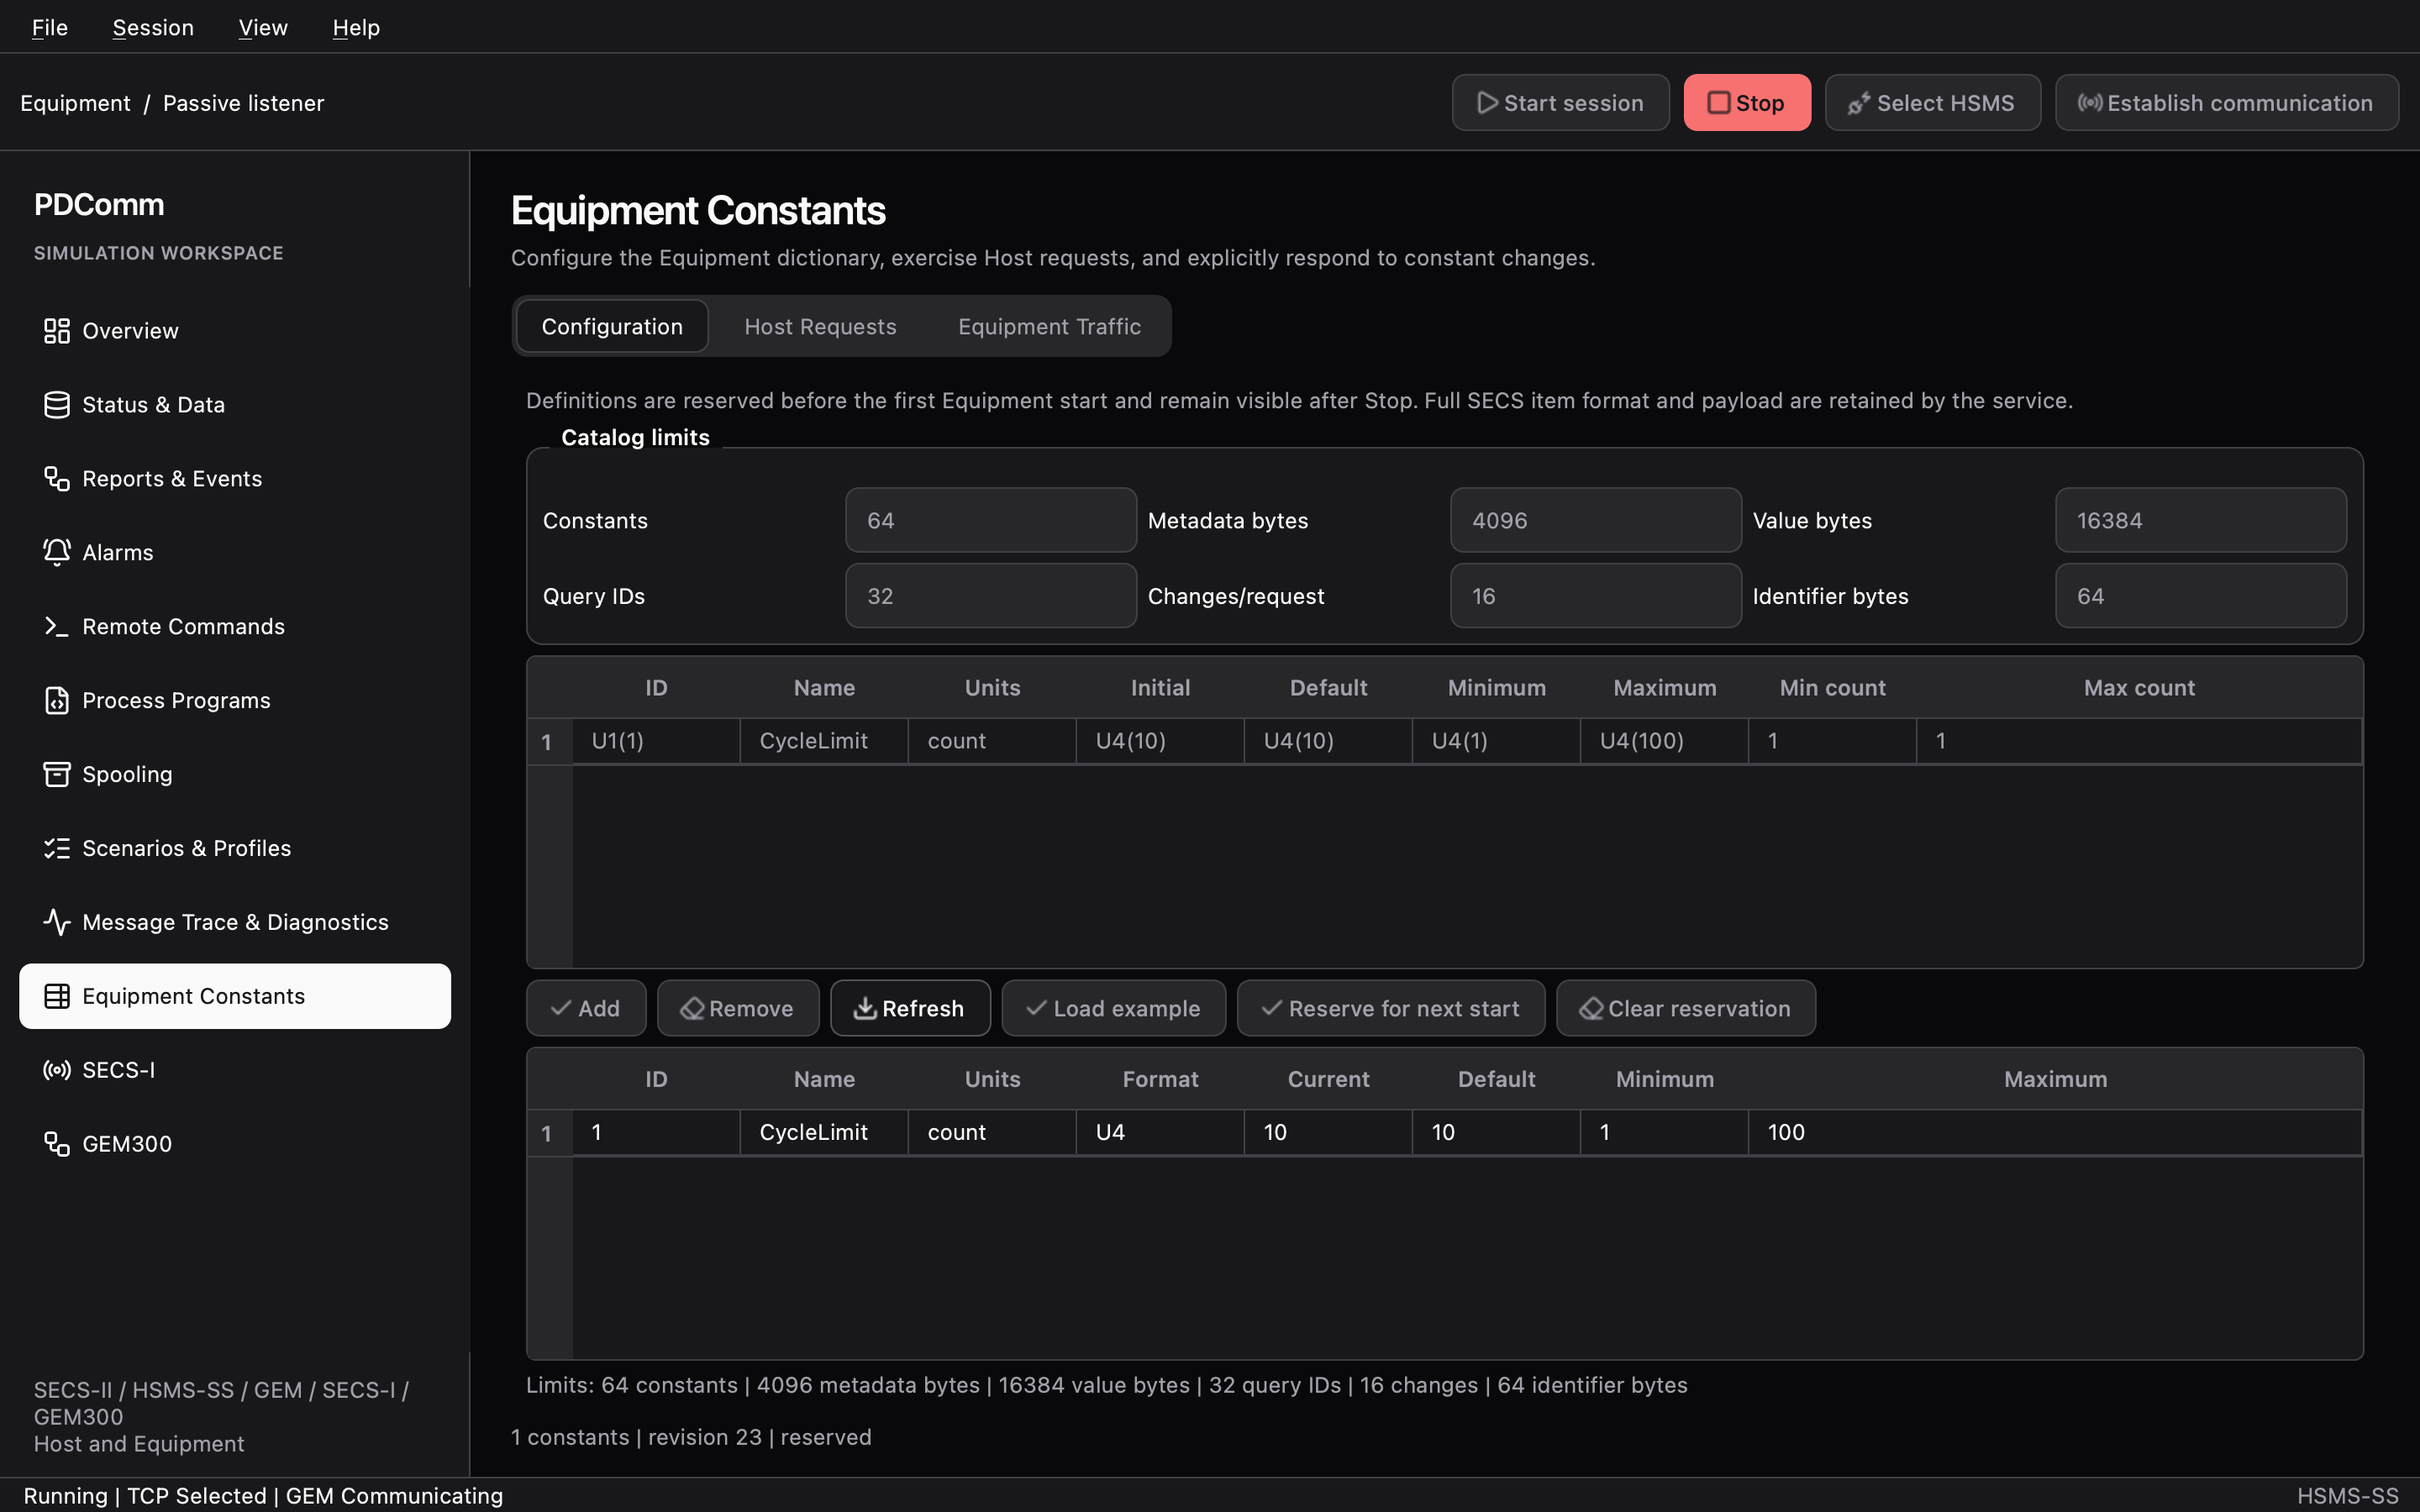
The default theme is Light. Switch to Dark under View > Appearance.
Drafts, next-start reservations, and the actual session catalog
Section titled “Drafts, next-start reservations, and the actual session catalog”This is the concept that trips people up most often. Every Equipment catalog passes through three stages:
workspace draft table project definitions running Equipment session (edit rows, Load example) --> (Use on next start) --> (actual session catalog) * appears in the title saved by File > Save Project shown in the "Actual ..." tables nothing is sent yet applied at the next what the Host actually sees Equipment Start session (Refresh / Refresh actual)- Draft. The editable tables in a workspace. Editing a row or clicking Load example changes only the draft; the running session is not touched.
- Next-start reservation. Use on next start validates the draft and stores it in the project definitions. Equipment Constants labels this button Reserve for next start, and the static event directory uses Reserve directory. The reservation takes effect the next time an Equipment session starts. Clear reservation removes it.
- Actual session catalog. What the running (or retained, stopped) session really holds. Read-only tables such as Actual session catalog, Actual session alarm catalog, and Actual session store show it; Refresh or Refresh actual reads it again.
You can edit reservations only in the Equipment role, and only when no session exists or the session is stopped. To change the catalog of a running Equipment, click Stop and then End session, update the reservation, and click Start session again.
Connect two simulators
Section titled “Connect two simulators”Run the simulator twice: one copy acts as the Equipment and the other as the Host. Every feature walkthrough starts from this setup.
- In the first simulator, open Overview. Set GEM role to Equipment, TCP mode to Passive - listen, Address to
127.0.0.1:5000, and Session ID to7. - Click Start session. The TCP TRANSPORT card changes to
Listening, and LOCAL ADDRESS shows127.0.0.1:5000. - In the second simulator, set GEM role to Host, TCP mode to Active - connect, Address to
127.0.0.1:5000, and Session ID to7, the same value as the Equipment. - Click Start session. The Host connects and sends Select automatically, and both HSMS SELECTION cards change to
Selected. - On the Host, click Establish communication. Both GEM COMMUNICATION cards change to
Communicating. - On the Host, open Status & Data, enter
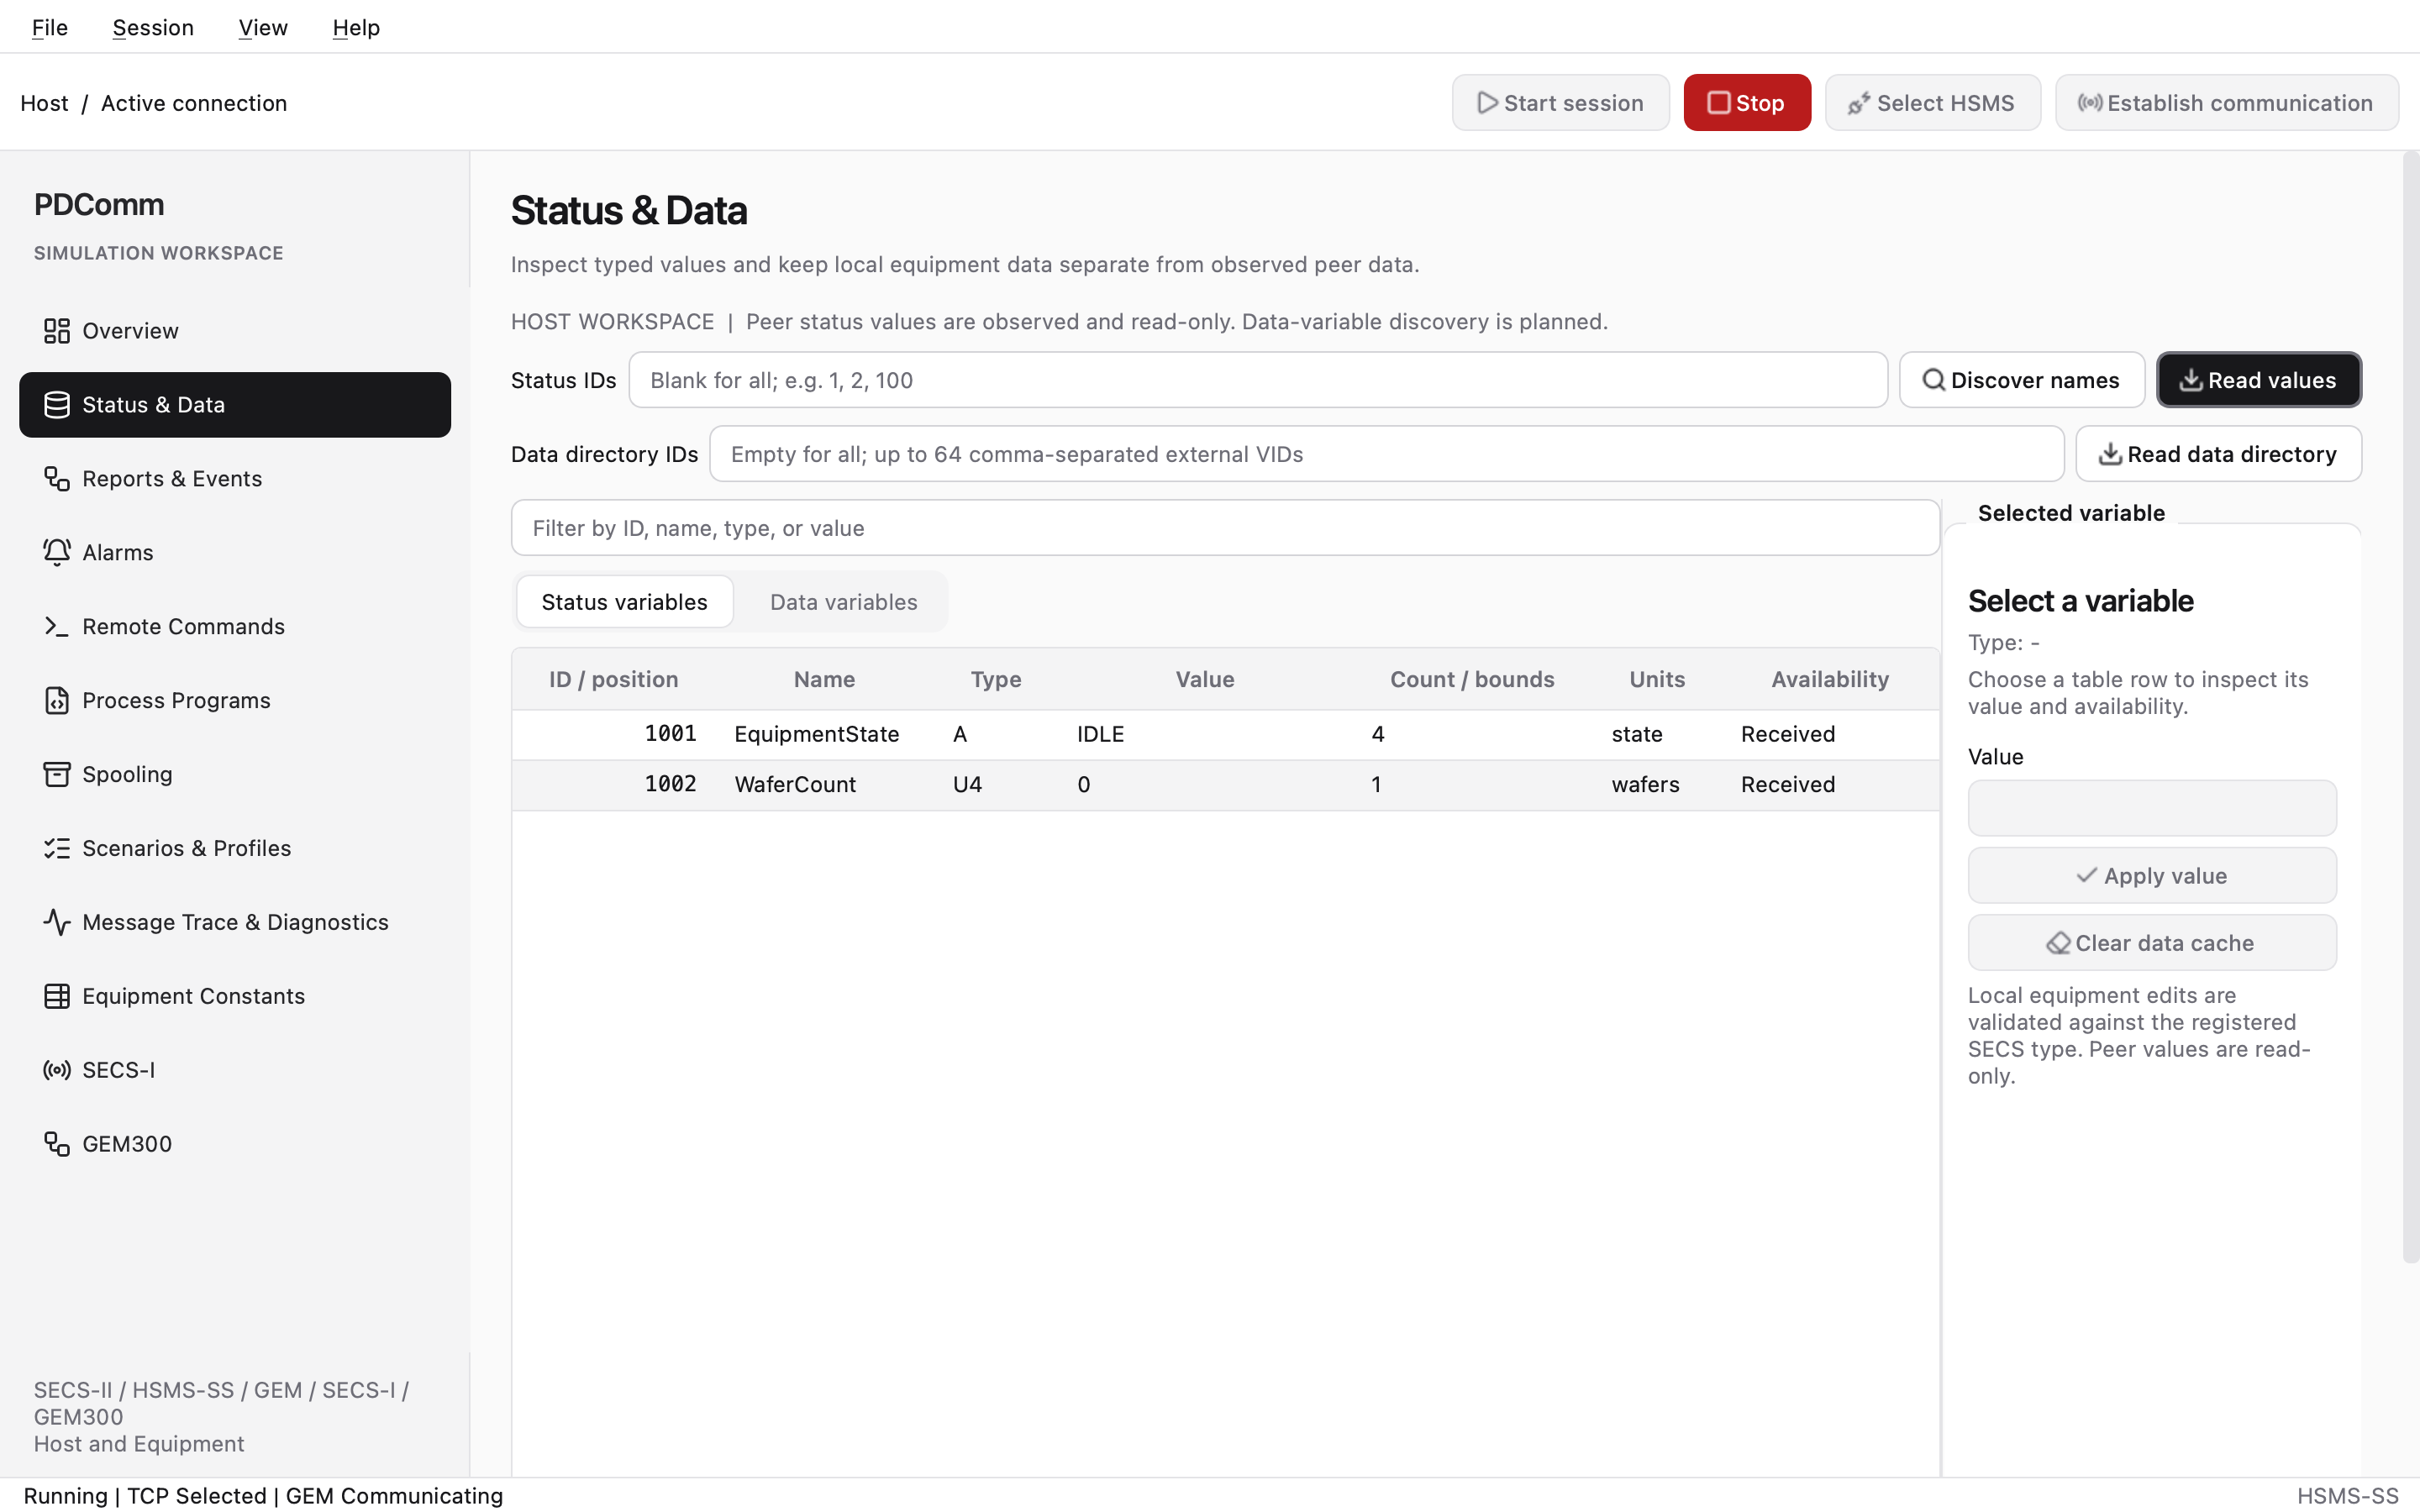
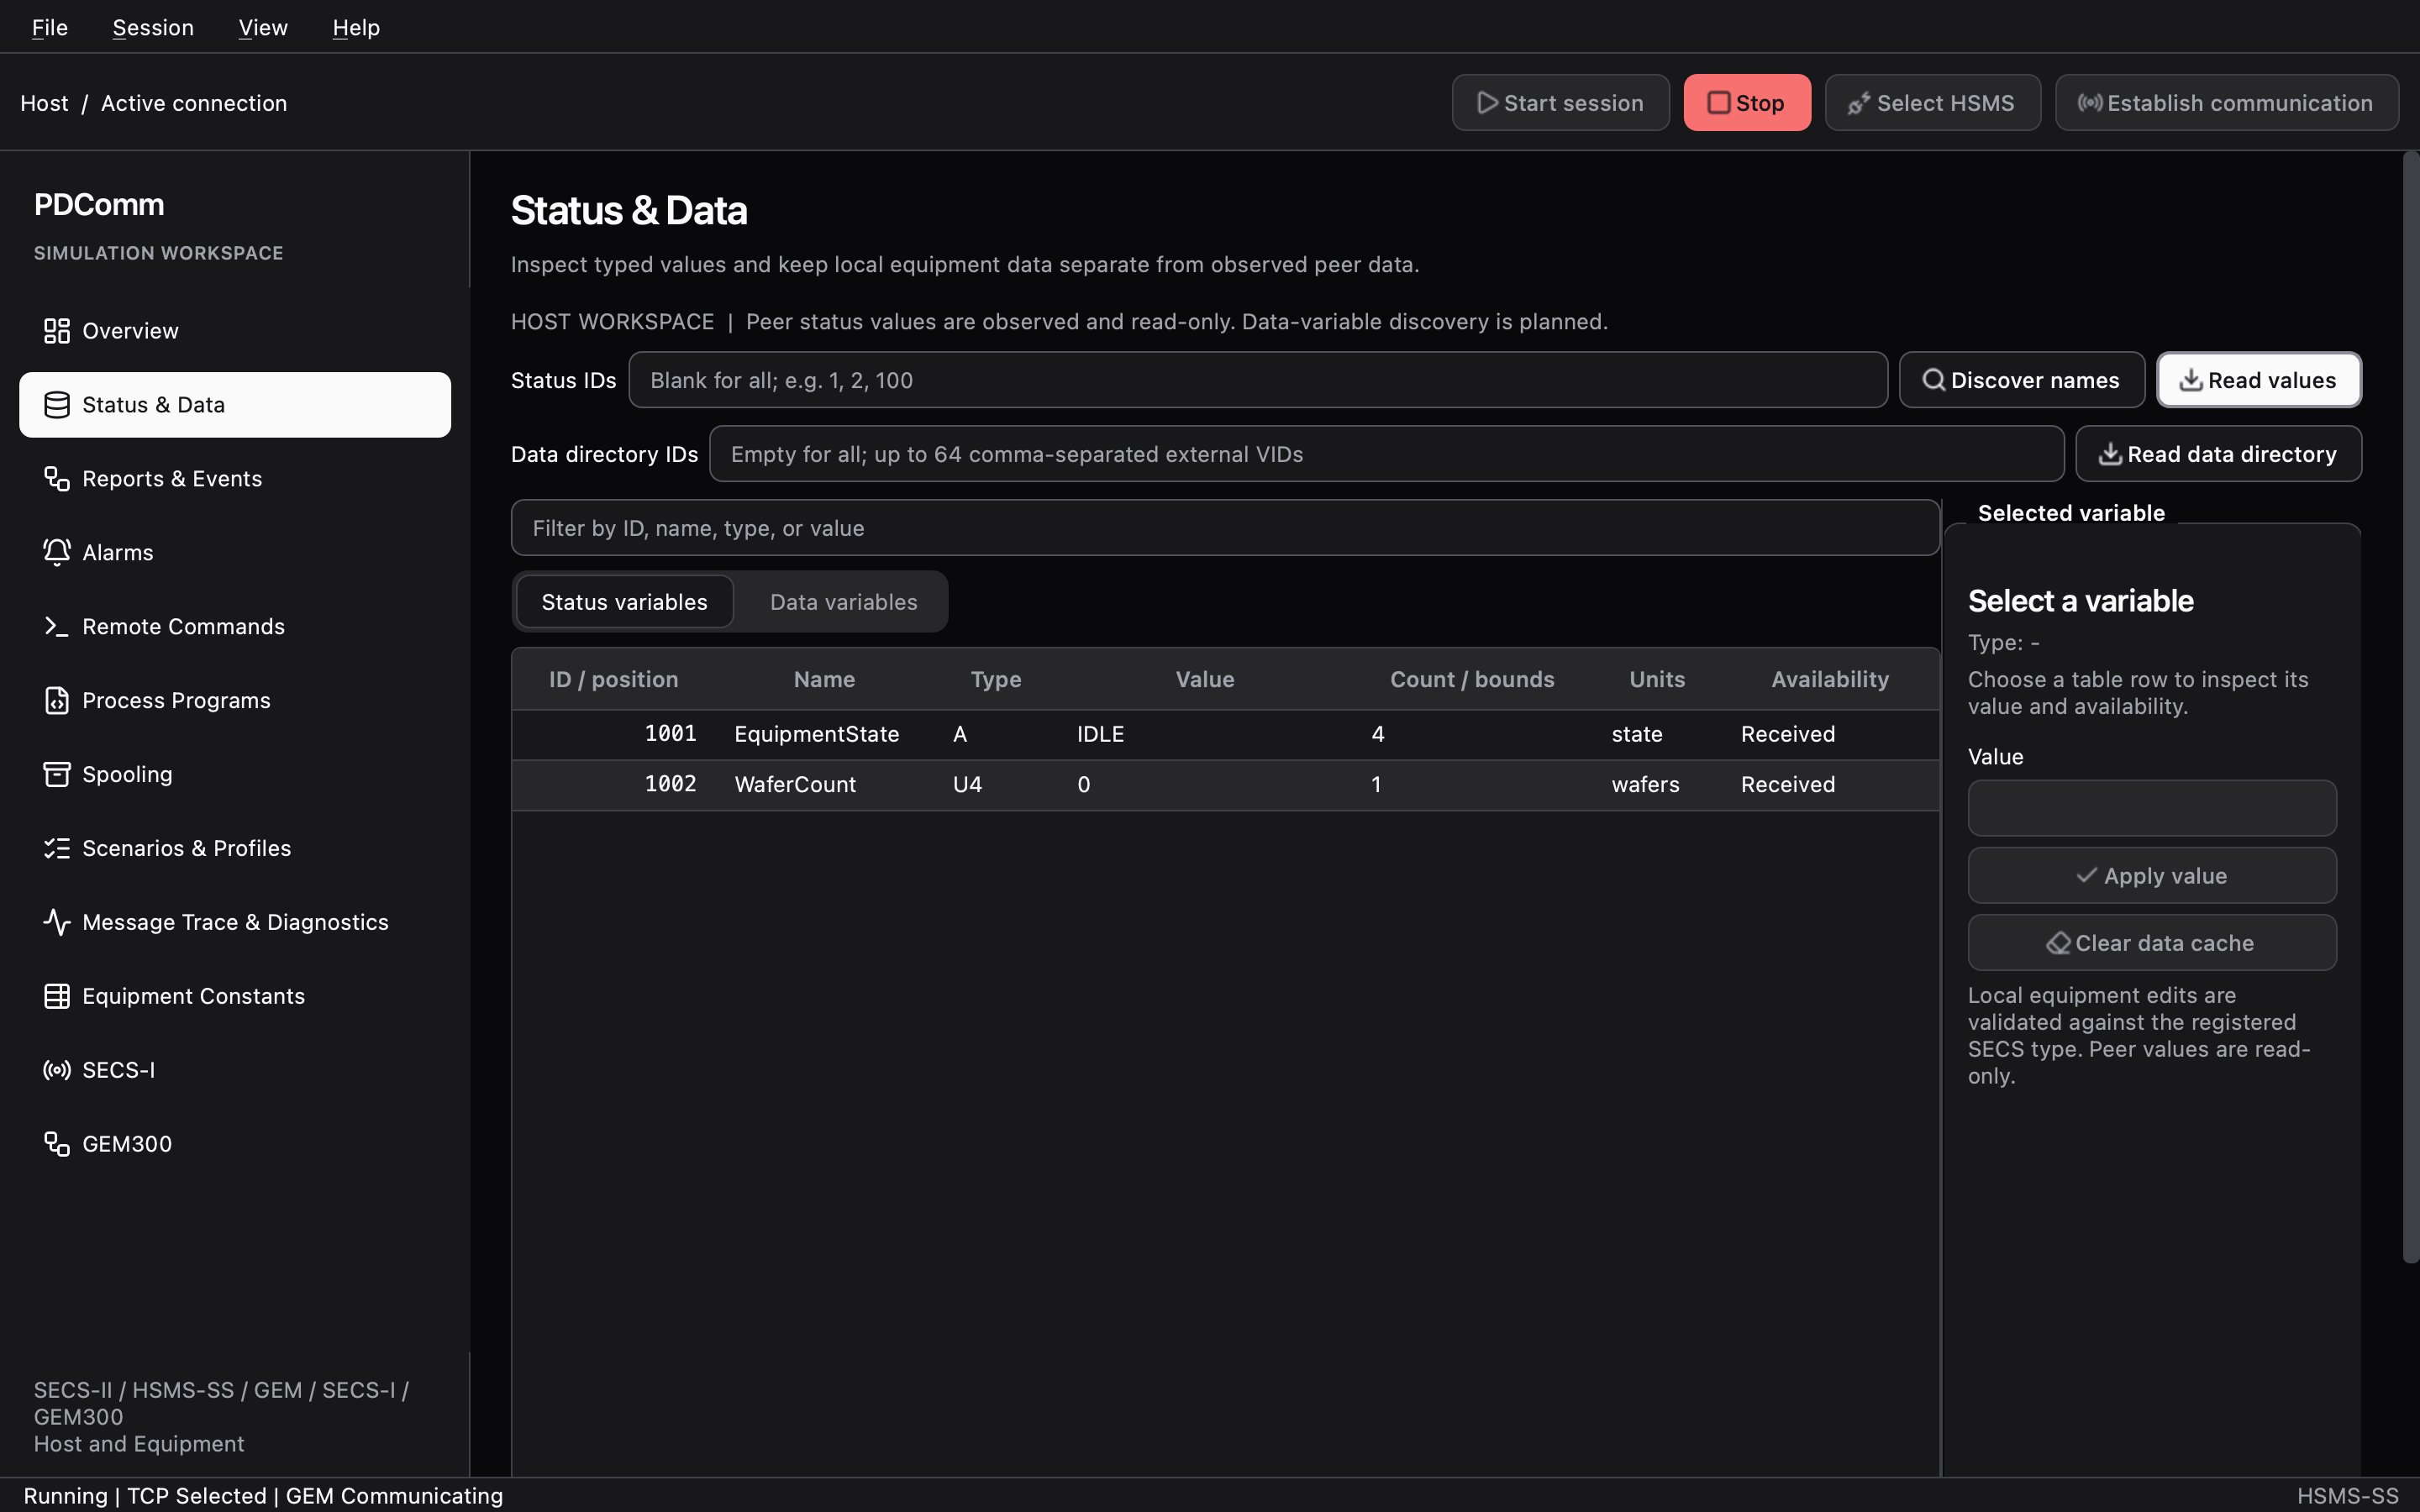
1001, 1002in Status IDs, click Discover names, and then click Read values.
The Equipment simulator has two built-in status variables. The Host table shows 1001 EquipmentState (ASCII IDLE) and 1002 WaferCount (U4 0) as Received. If you send the same request with the SDK tutorial host, the S1F4 body is 01 02 41 04 49 44 4c 45 b1 04 00 00 00 00. The Equipment simulator answers S1F1 with MDLN PDComm Simulator and SOFTREV 1.
If the sessions don’t reach Communicating, see Connection and timeout problems.
Workspaces
Section titled “Workspaces”Overview
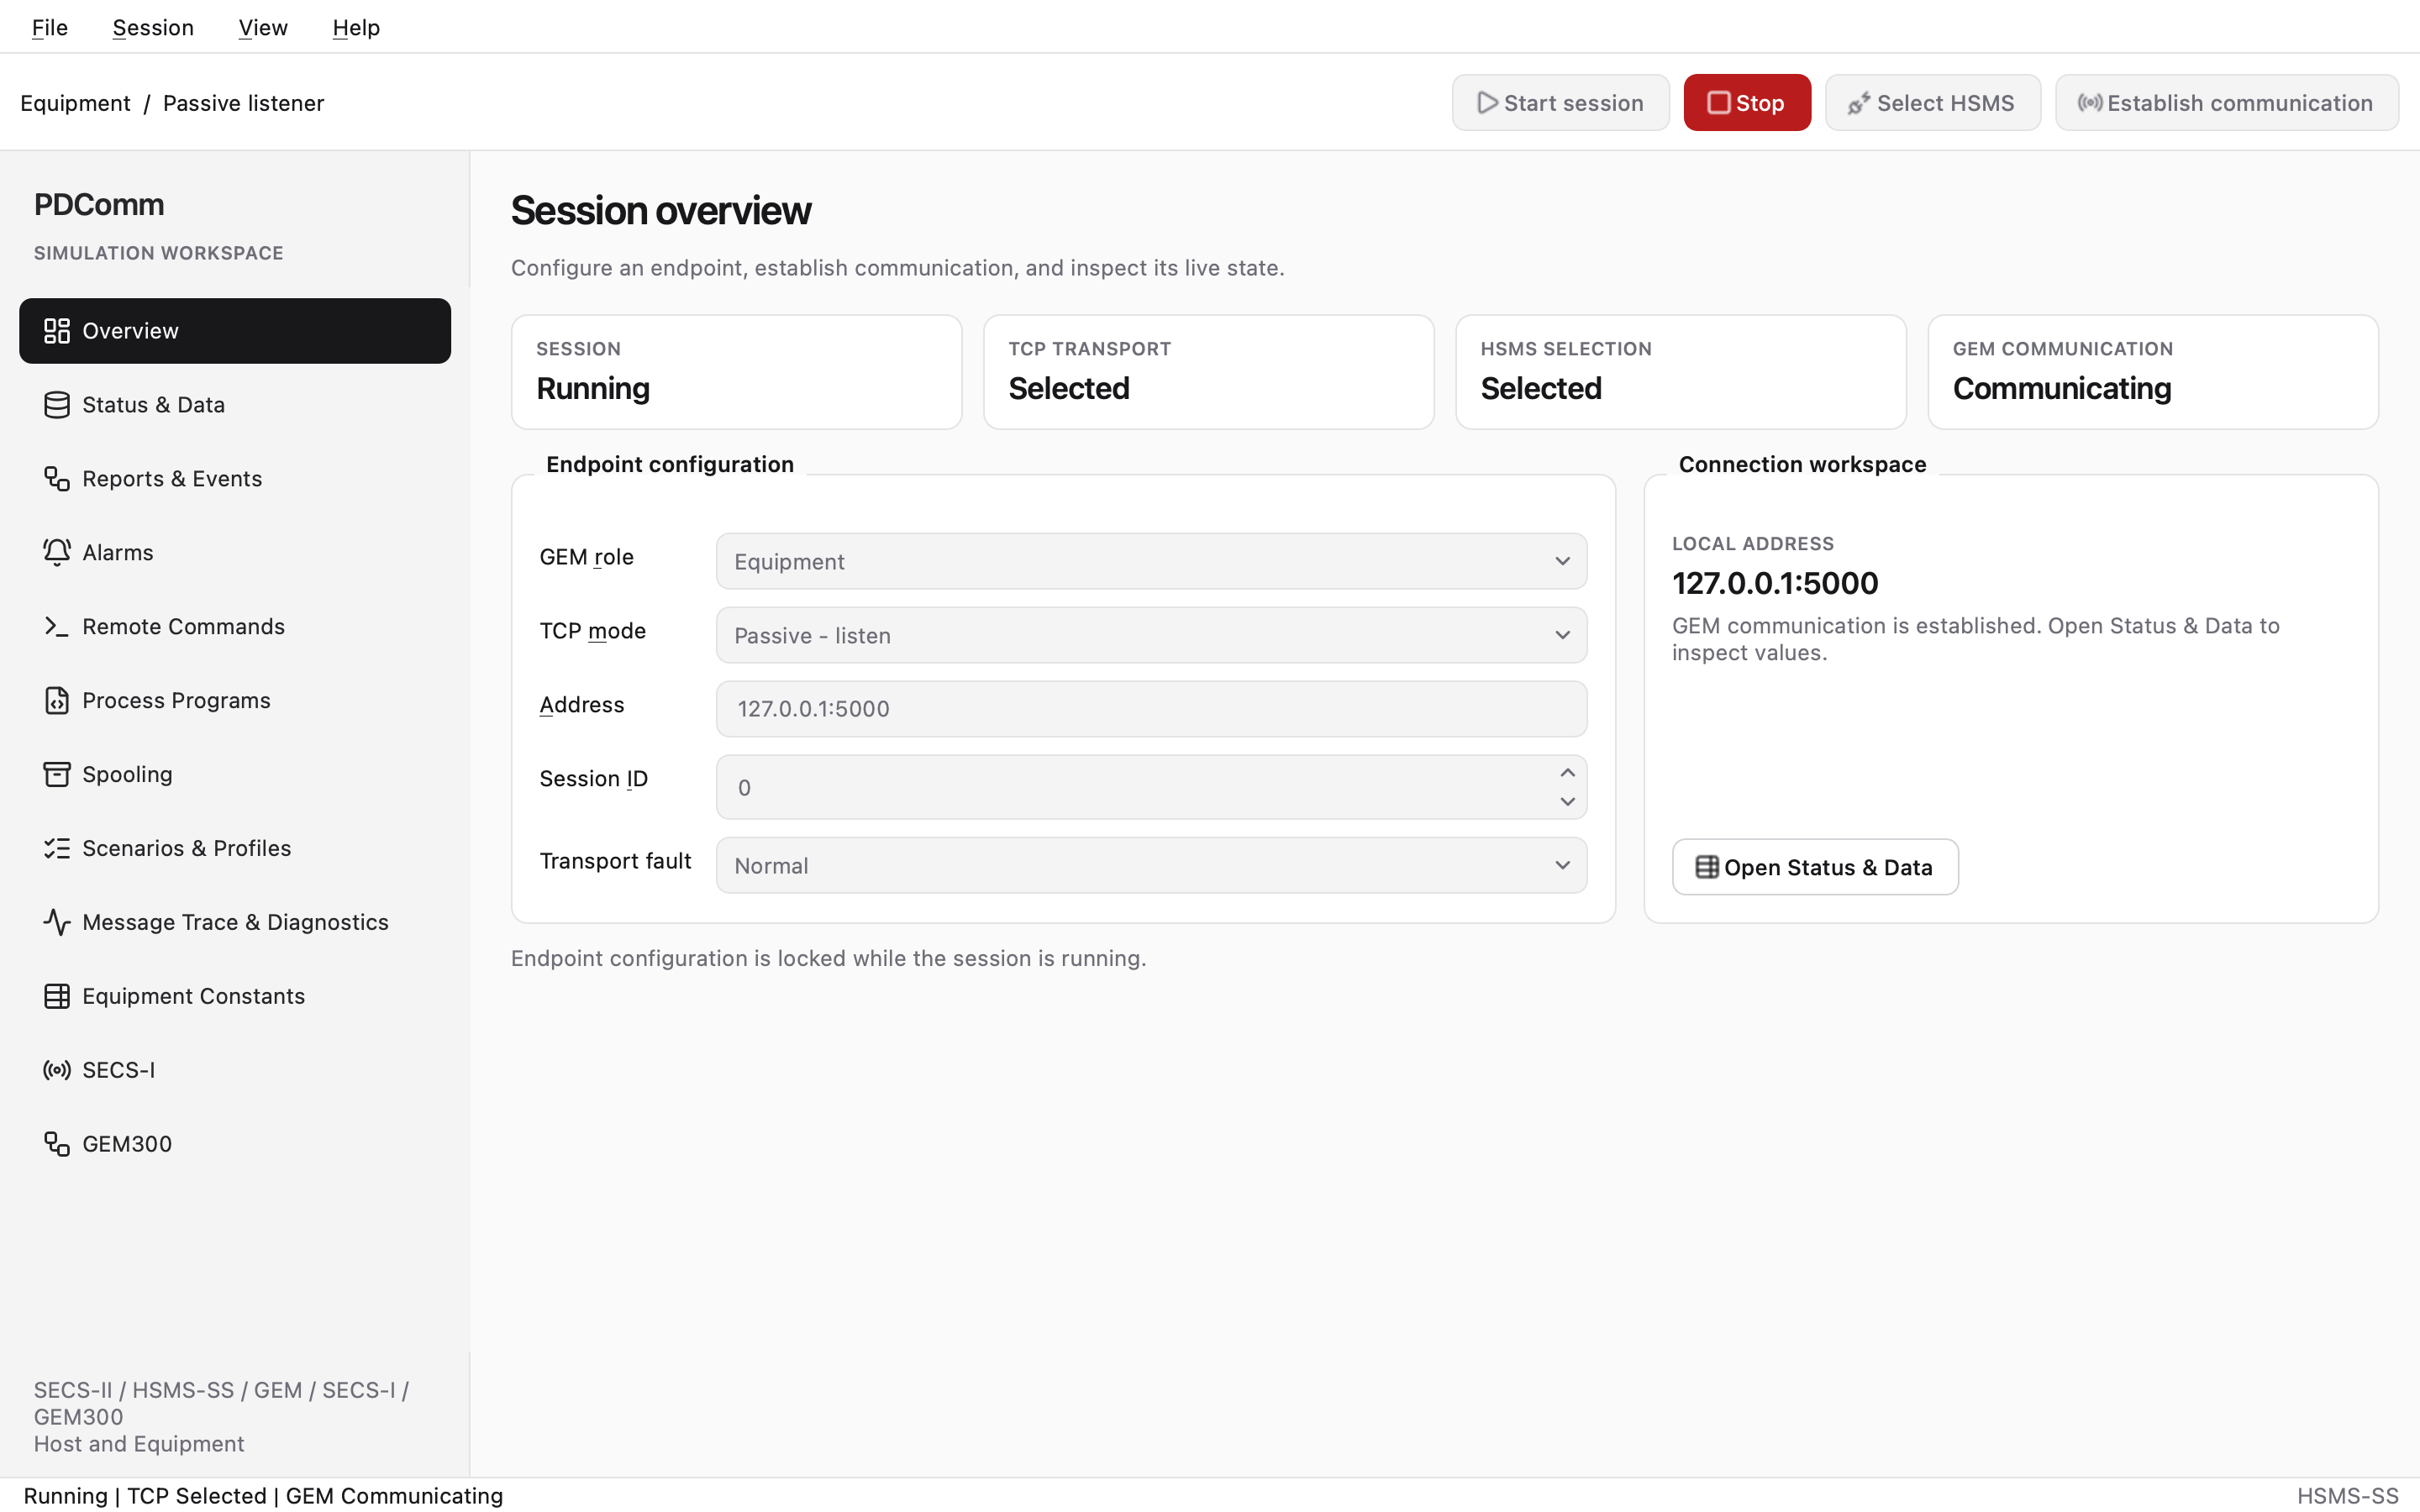
Section titled “Overview”The page title is Session overview. It holds the endpoint settings and the live state.
- State cards: SESSION (
Idle,Running,Stopped, and so on), TCP TRANSPORT (Stopped,Connecting,Listening,NotSelected,Selected,RetryWait), HSMS SELECTION, and GEM COMMUNICATION (Disconnected,NotCommunicating,WaitingAck,Communicating). - Endpoint configuration: GEM role (Host or Equipment), TCP mode (Active - connect or Passive - listen), Address (default
127.0.0.1:5000), Session ID (0–65535, default 0), and Transport fault (Normal or Write backpressure). These fields lock while a session exists. - Connection workspace: LOCAL ADDRESS shows the address the endpoint actually bound. In passive mode with port
0, this is where you find the port the operating system picked. Open Status & Data jumps to the variables workspace.
Write backpressure is a test profile that stalls writes on purpose. You arm and release it in the Message Trace & Diagnostics workspace, described below.
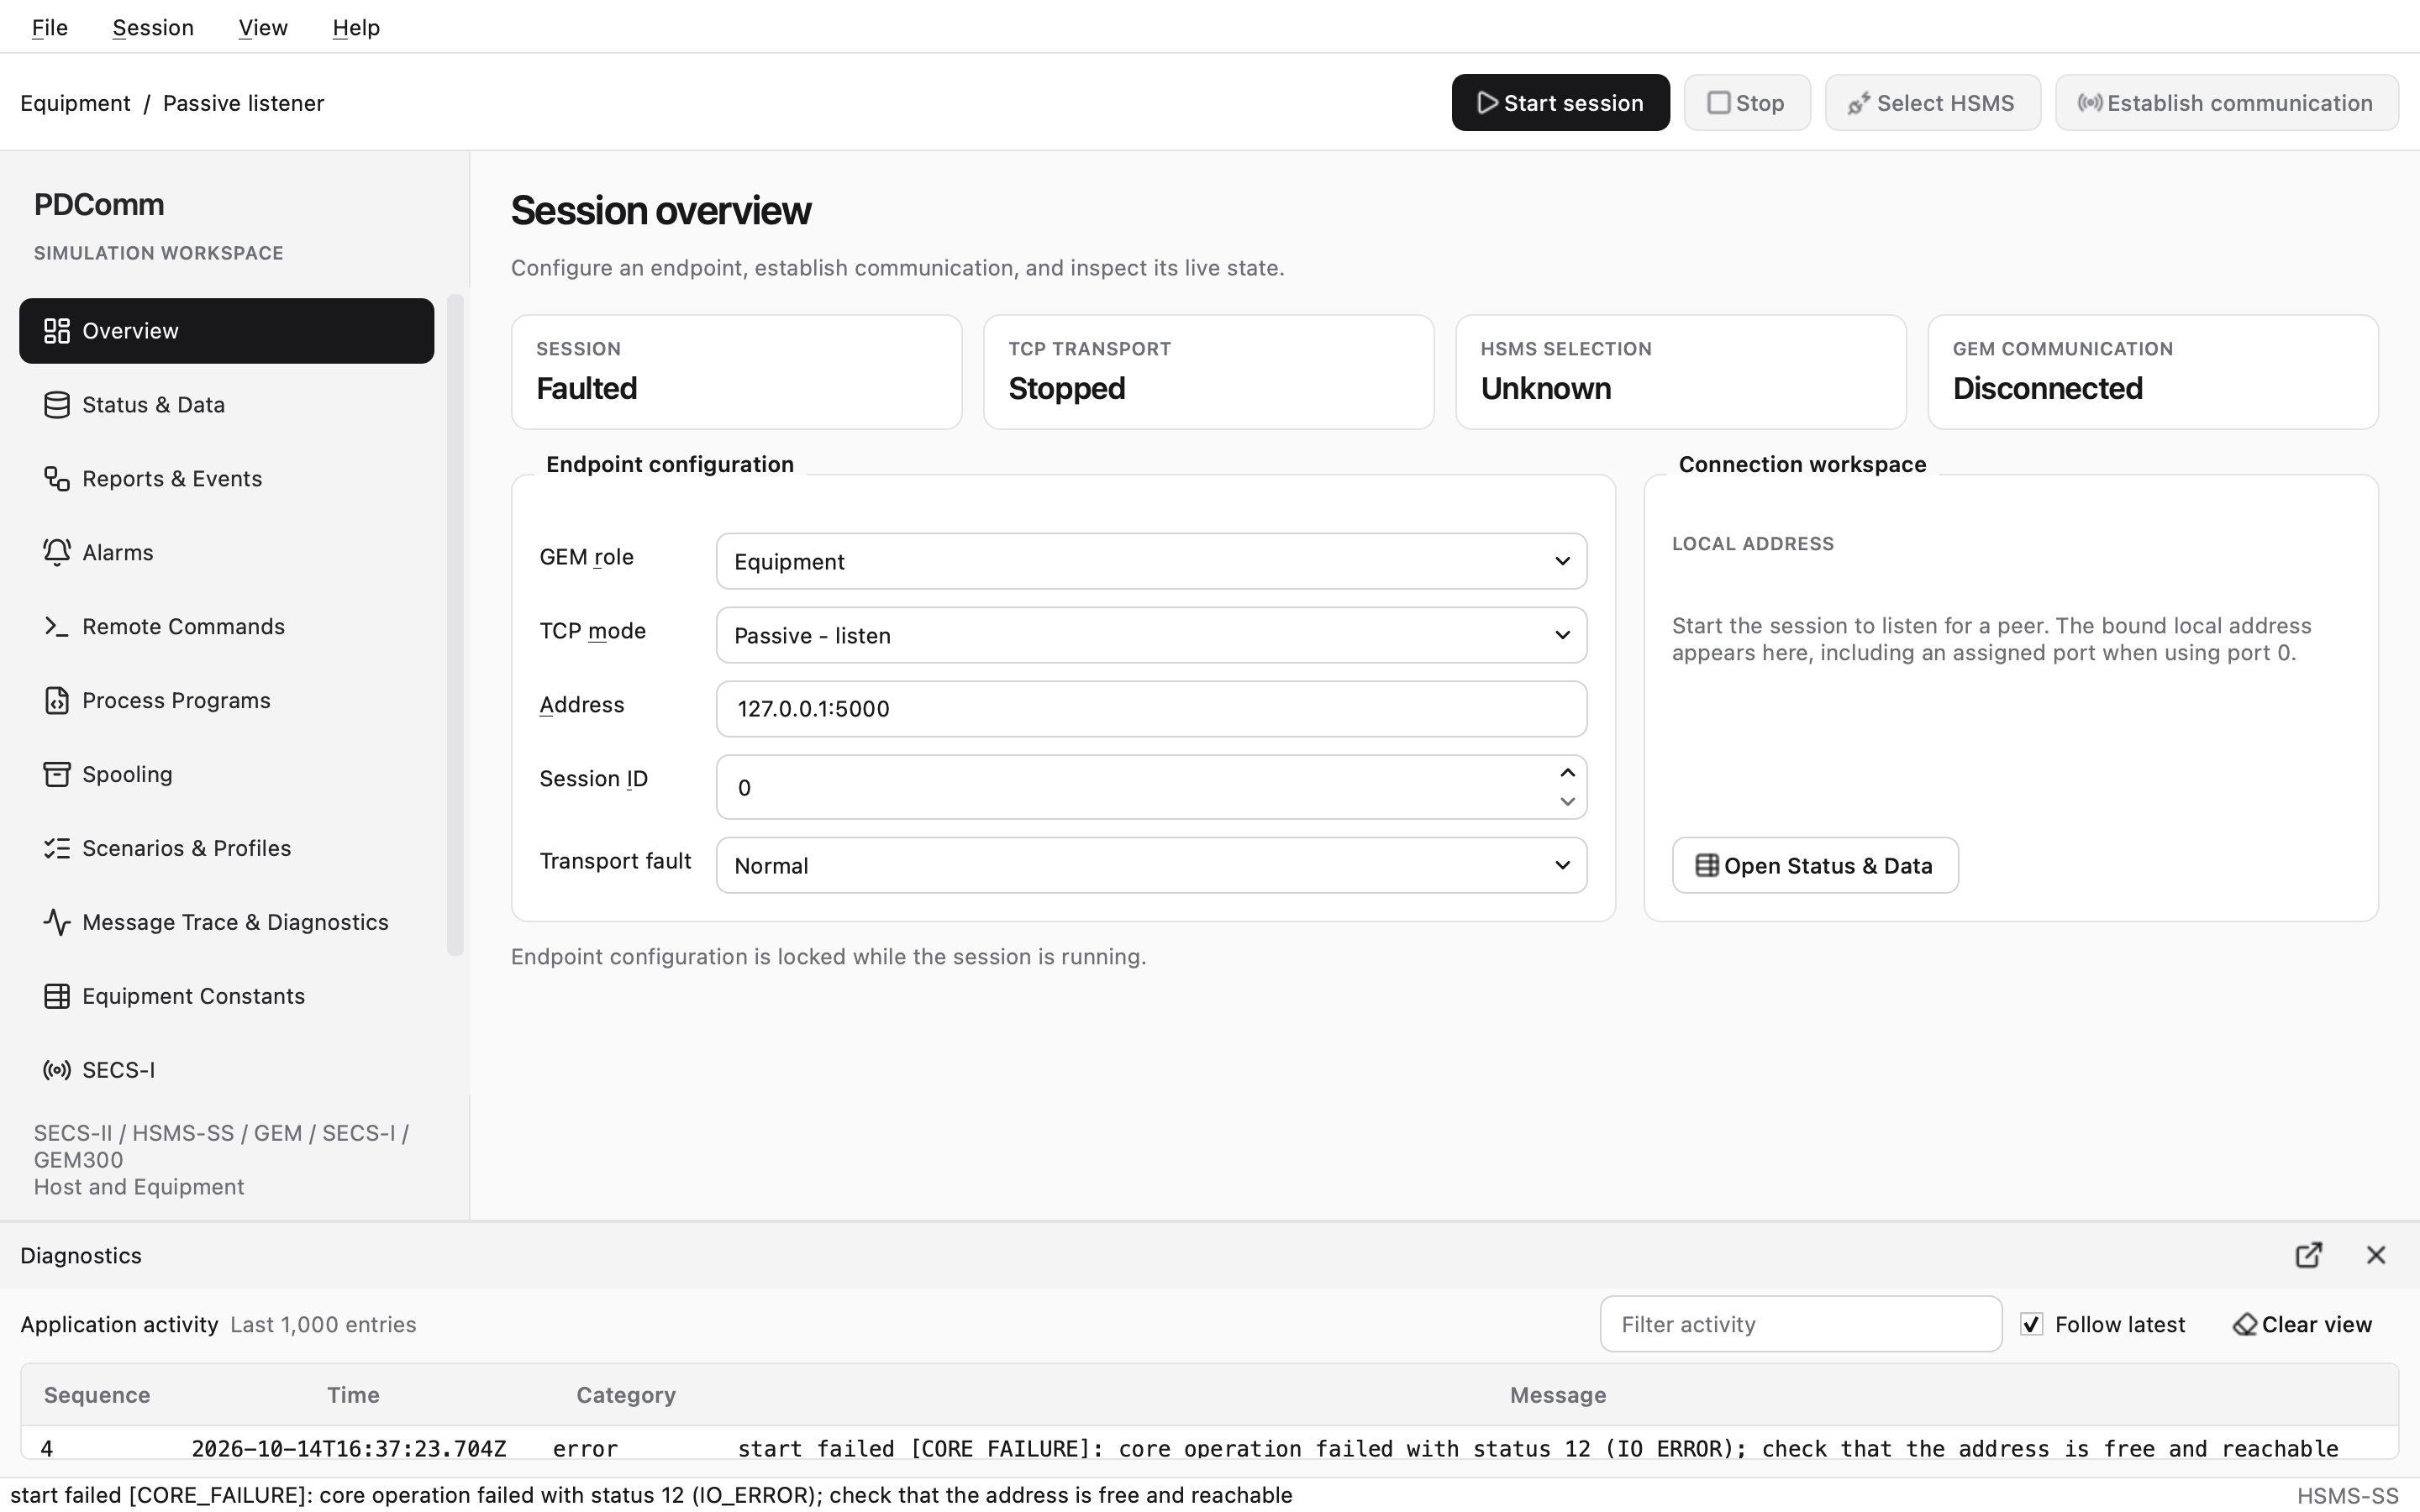
If Start session fails, the SESSION card changes to Faulted, and the reason appears in the Diagnostics dock and the status bar. For example, when another program already uses the same address and port, you see start failed [CORE_FAILURE]: core operation failed with status 12 (IO_ERROR); check that the address is free and reachable. Pick another port, or stop the program that holds it, and start again.
Status & Data
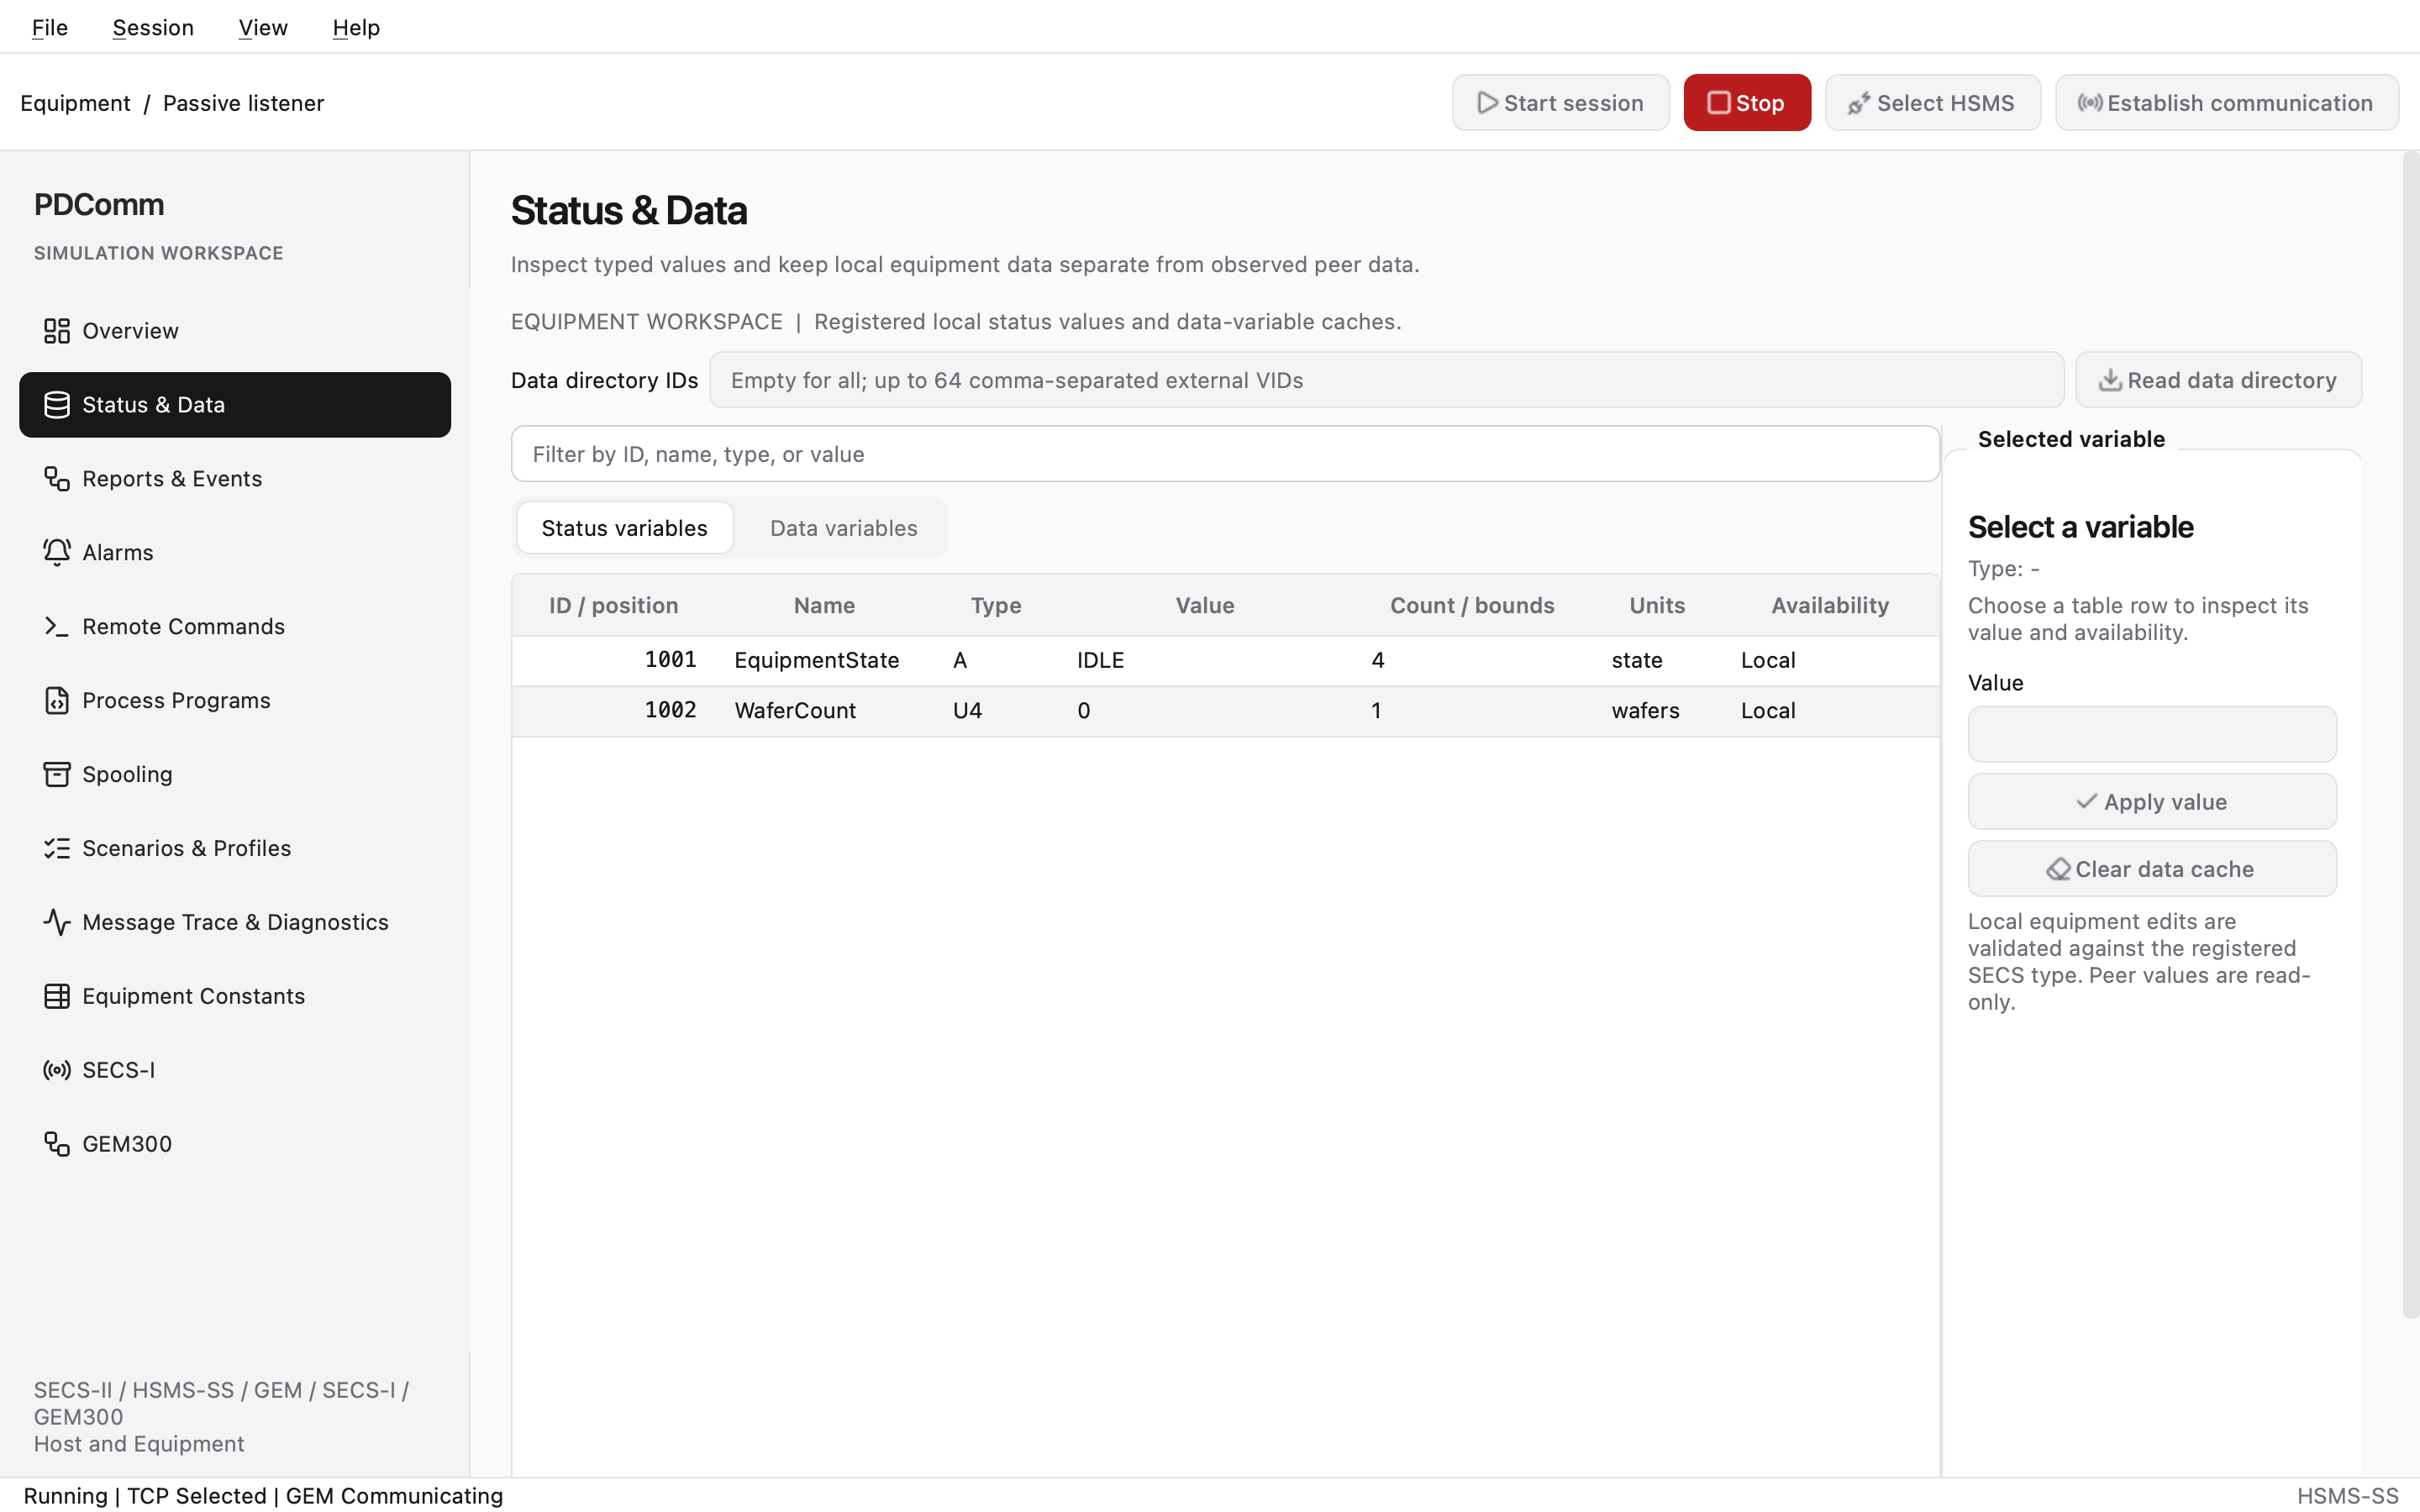
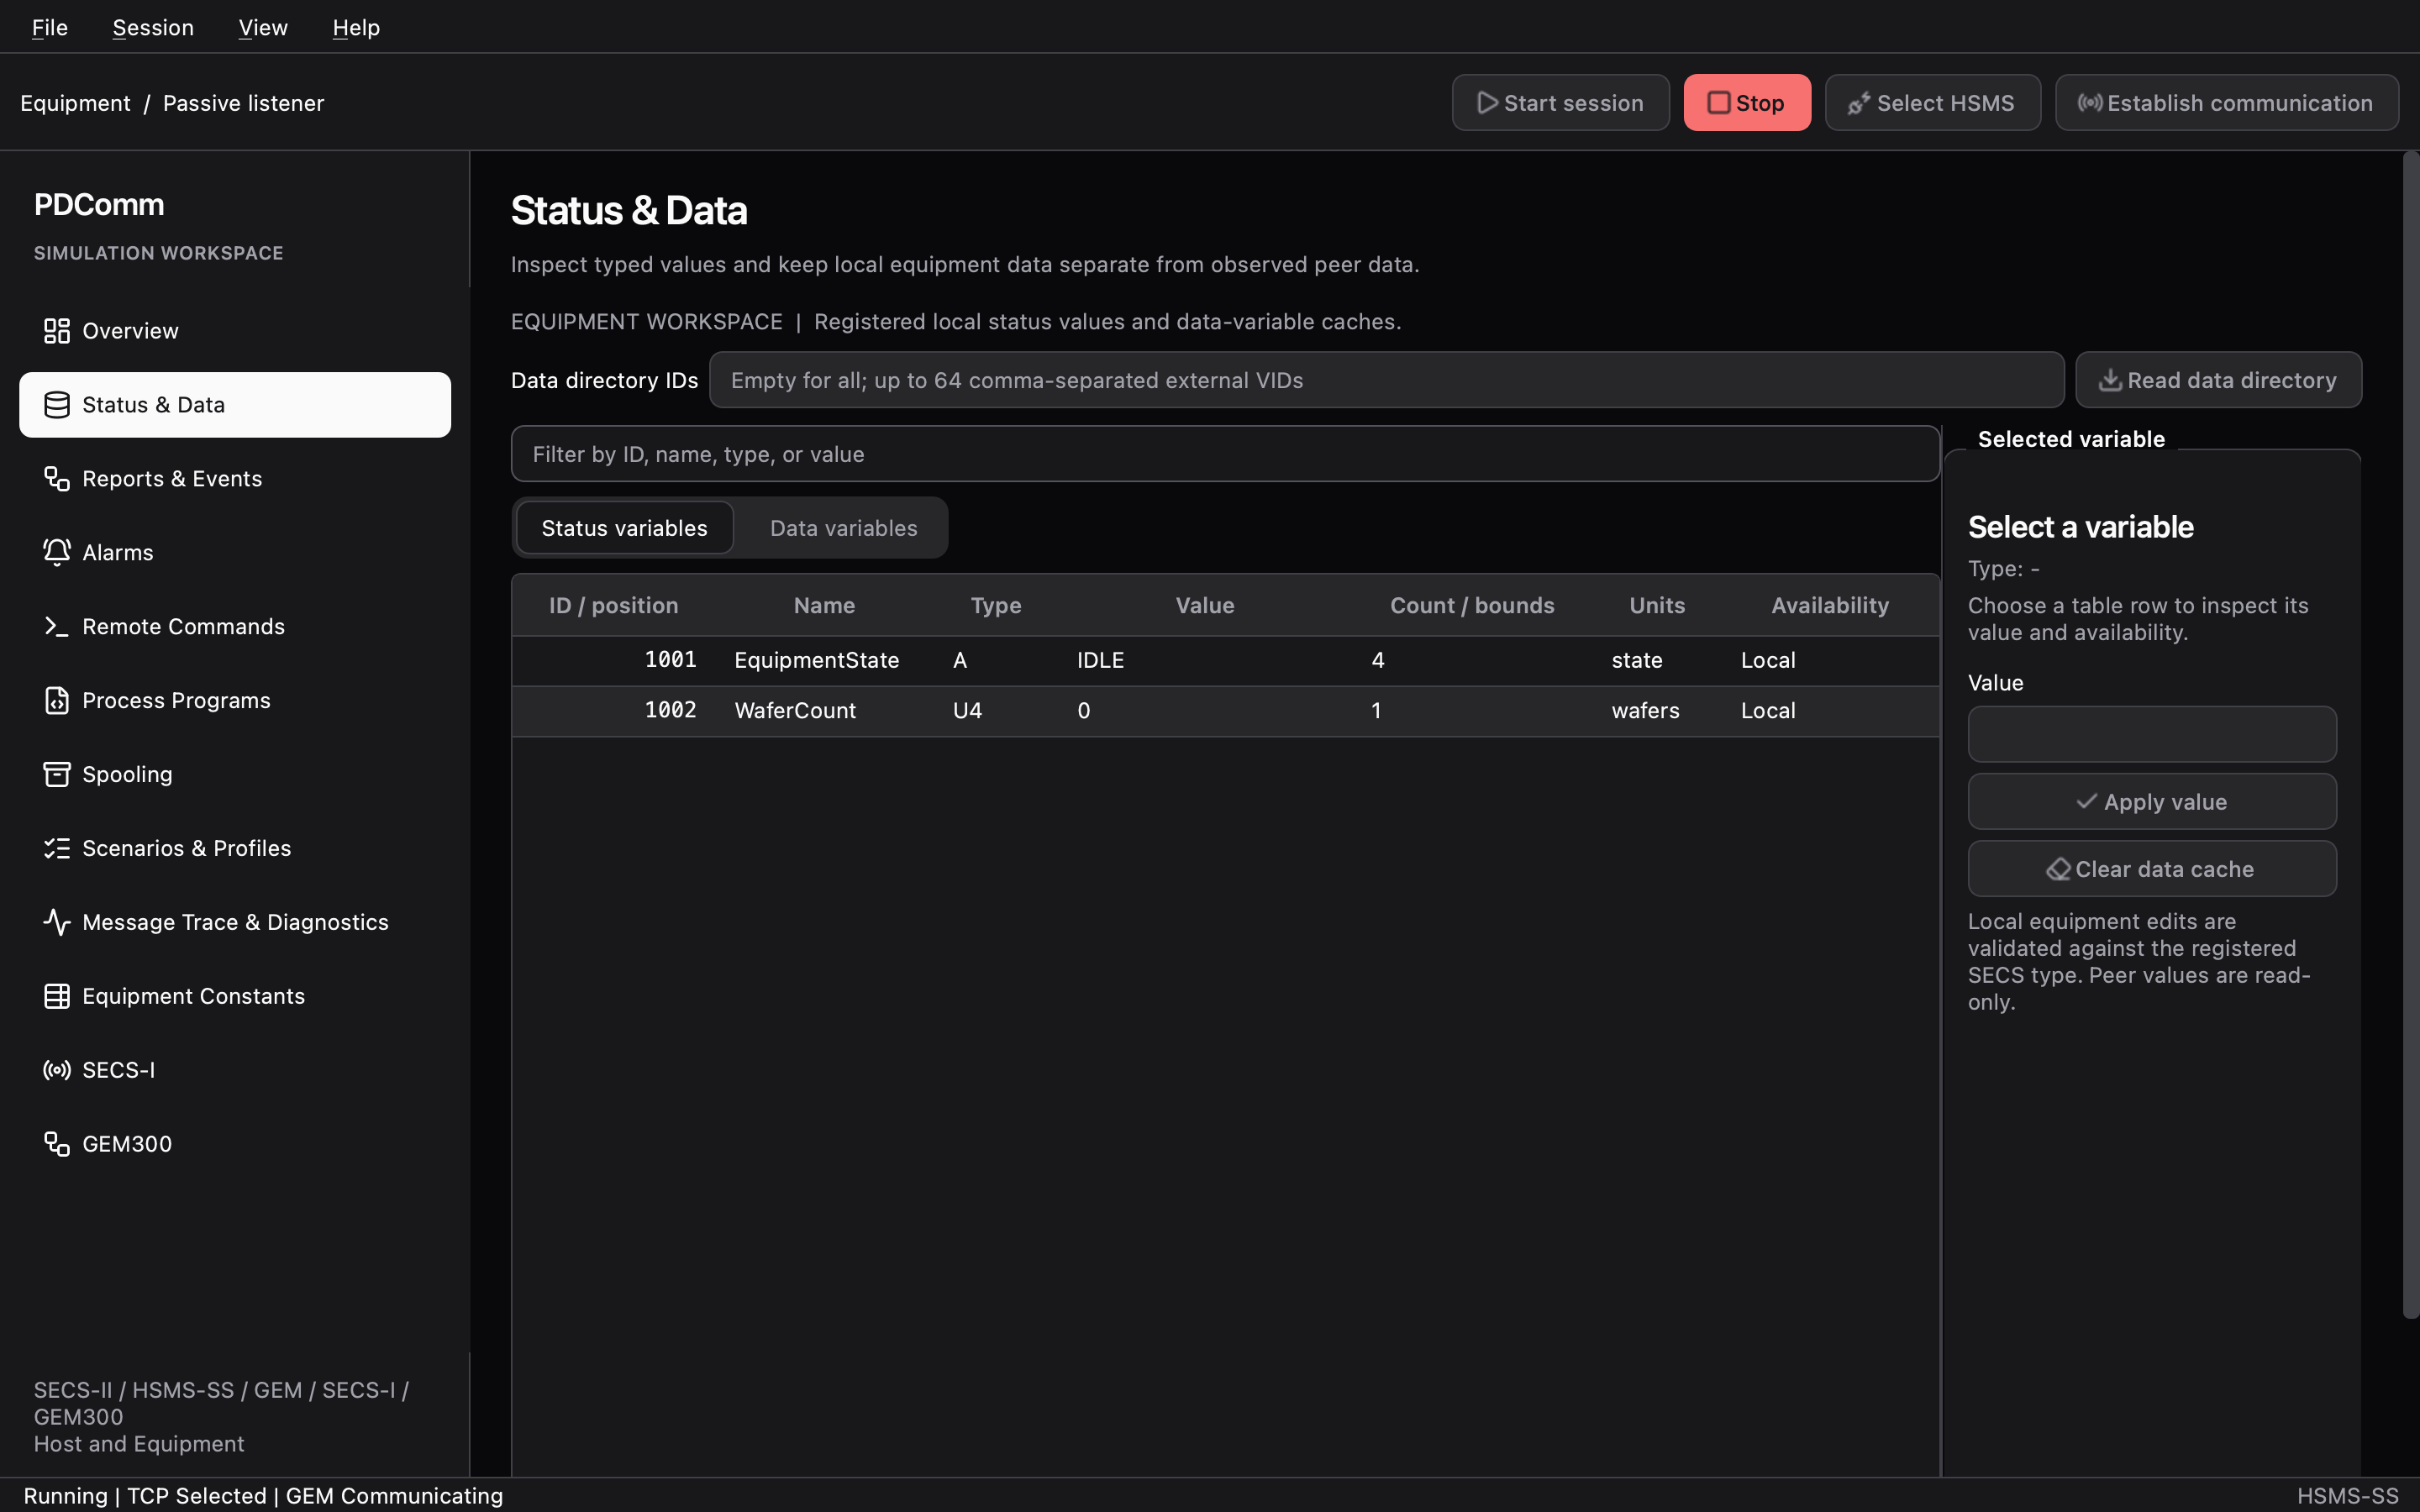
Section titled “Status & Data”Shows status variables (SVs) and data variables (DVs). On the Equipment you see your own values; on the Host you see the values received from the peer.
- Host: enter IDs in Status IDs (leave it blank for all), then click Discover names and Read values in that order. Read values stays disabled until the names are known. Data directory IDs and Read data directory request the data variable directory (S1F21).
- Equipment: select a variable, type a value of the same SECS format in Value, and click Apply value. For data variables, Clear data cache empties the cache.
- The tabs are Status variables and Data variables. The Availability column reads
Received,Not read,Cached,No cache, orLocal.
Without an applied profile, the Equipment has these variables:
| ID | Kind | Name | Format | Value |
|---|---|---|---|---|
| 1001 | Status | EquipmentState |
ASCII | IDLE |
| 1002 | Status | WaferCount |
U4 | 0 |
| 2001 | Data | LotId |
ASCII | LOT-001 |
| 2002 | Data | GoodCount |
U4 | 0 |
Reserve a data variable catalog in the Data catalog and cache group on the Data variables tab. Load example fills the draft with 2001 WaferCount (U4(10)), 2002 RecipeName (ASCII(DEMO)), and 2003 Flags (BINARY(01 02)). Reserve it with Use on next start and check the result with Refresh actual.
Walkthrough: Data collection
Reports & Events
Section titled “Reports & Events”Covers reports and collection events. The tabs are Catalog, Remote configuration, and Traffic.
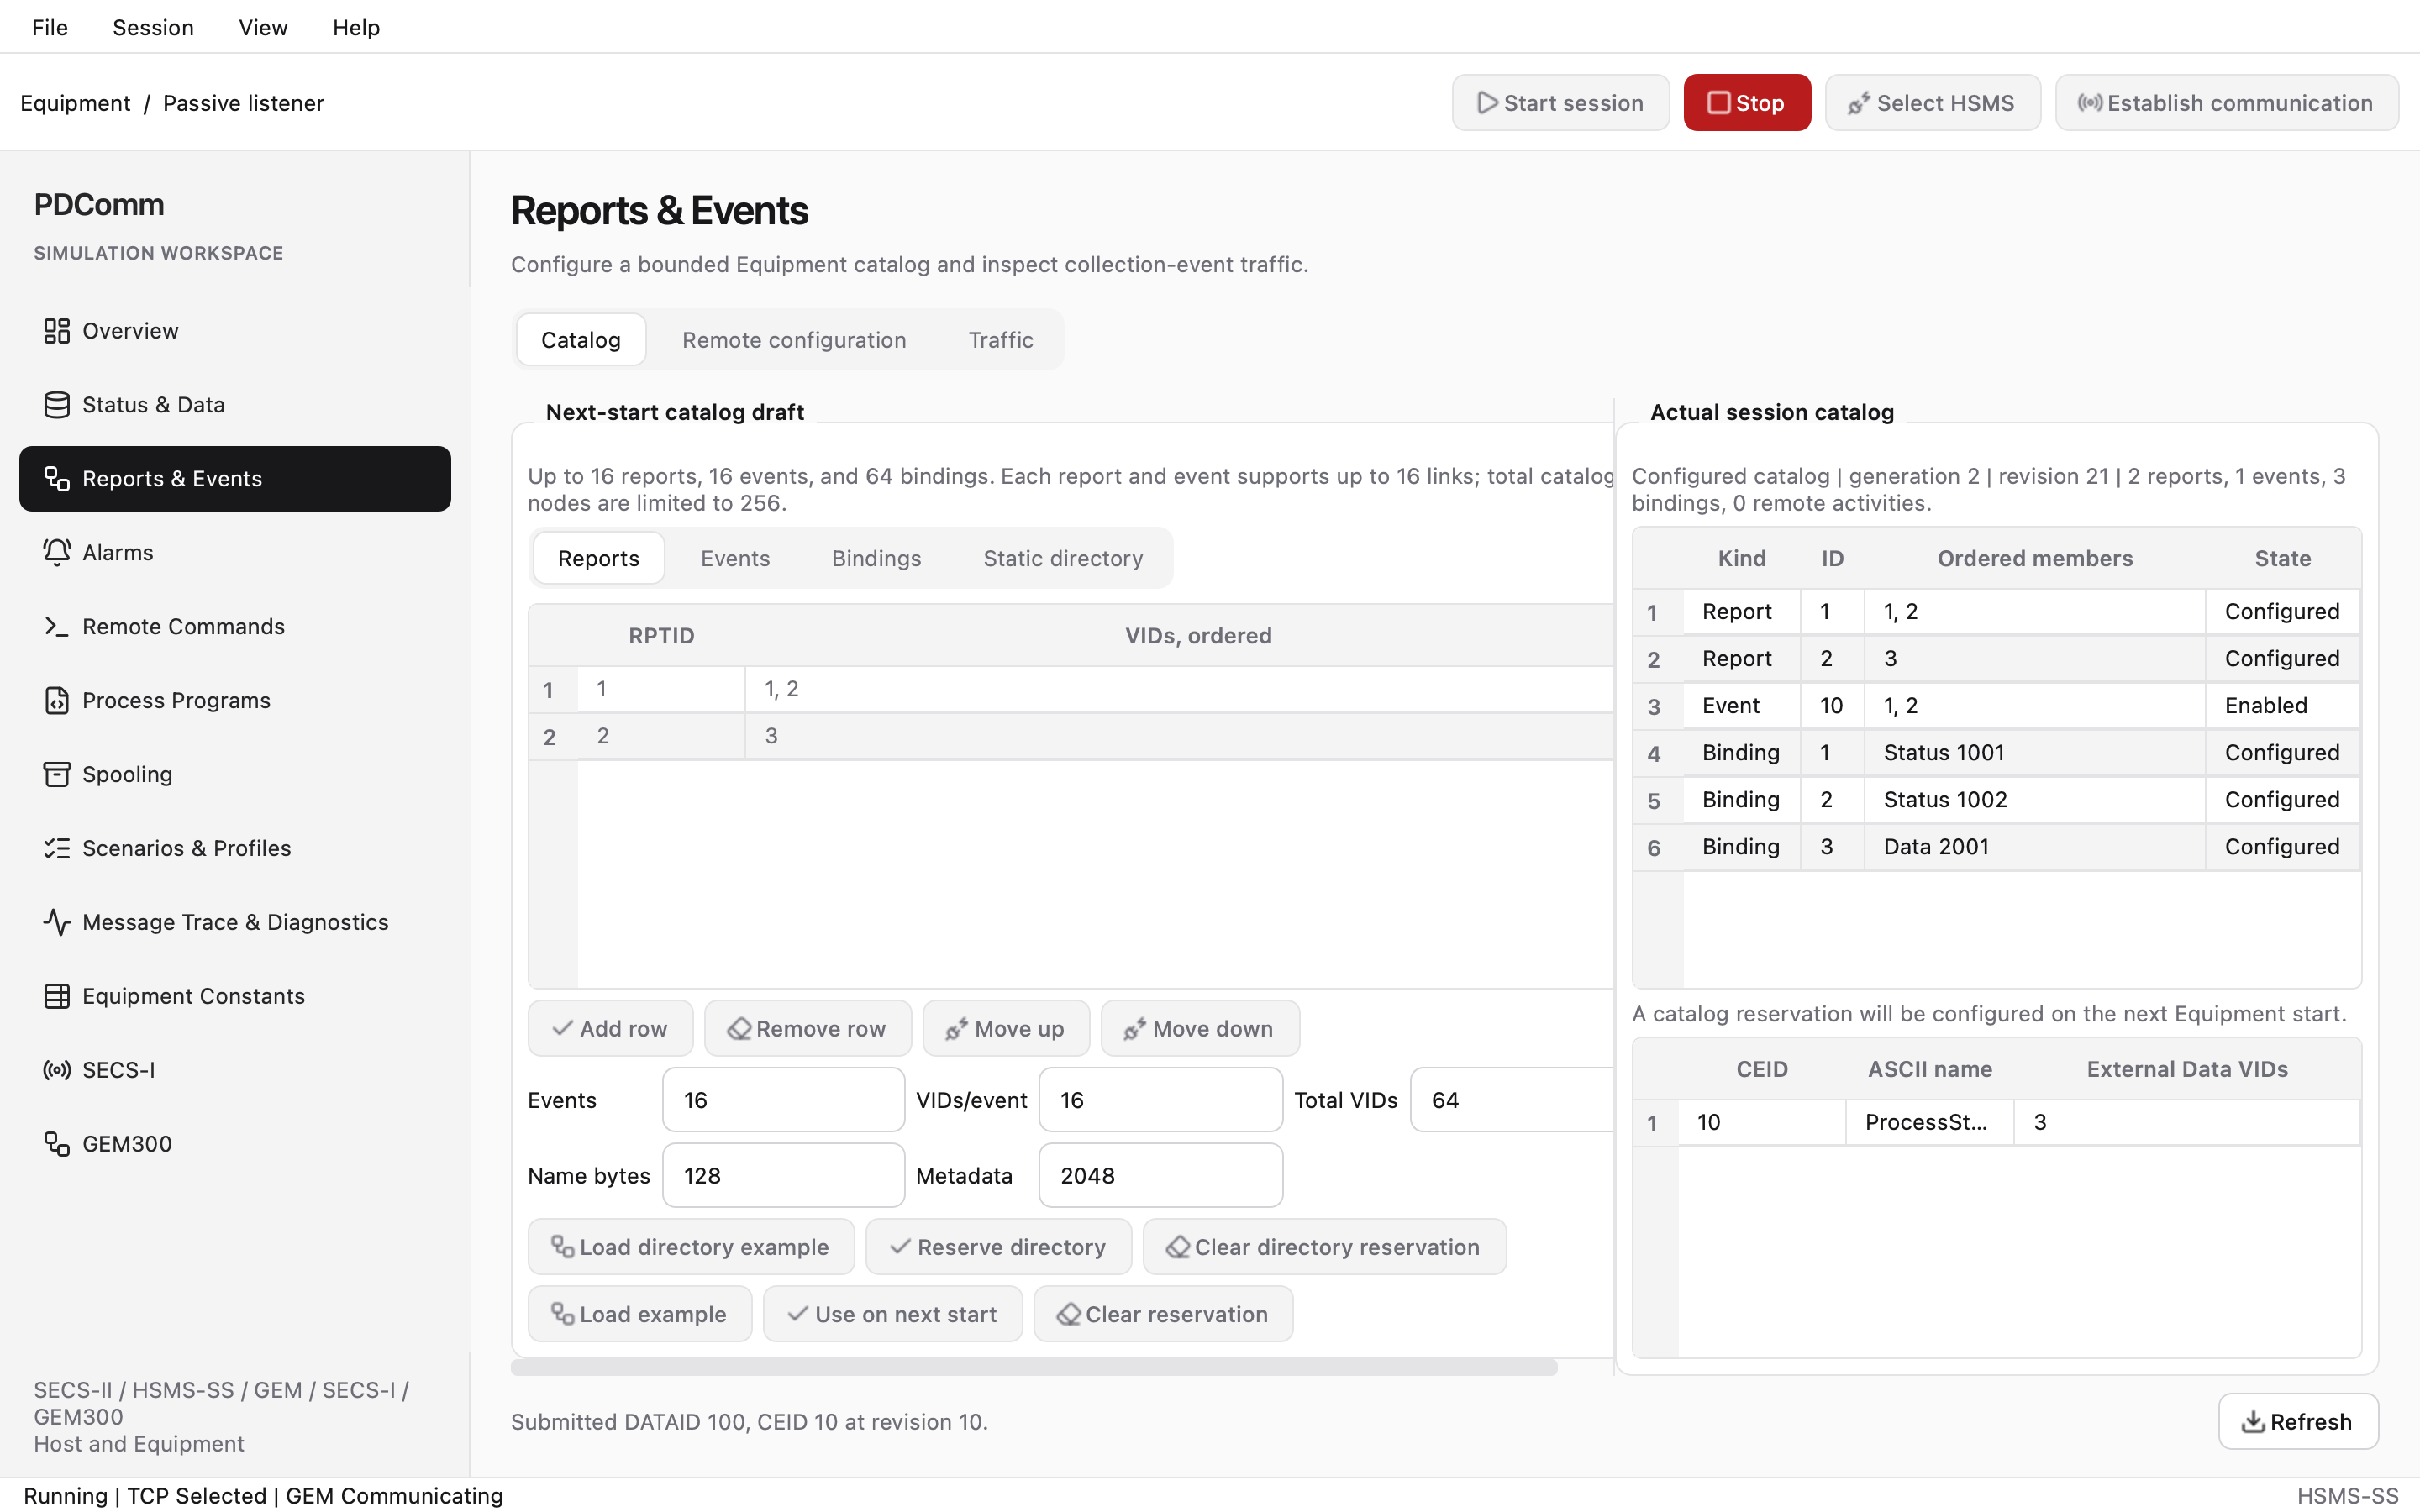
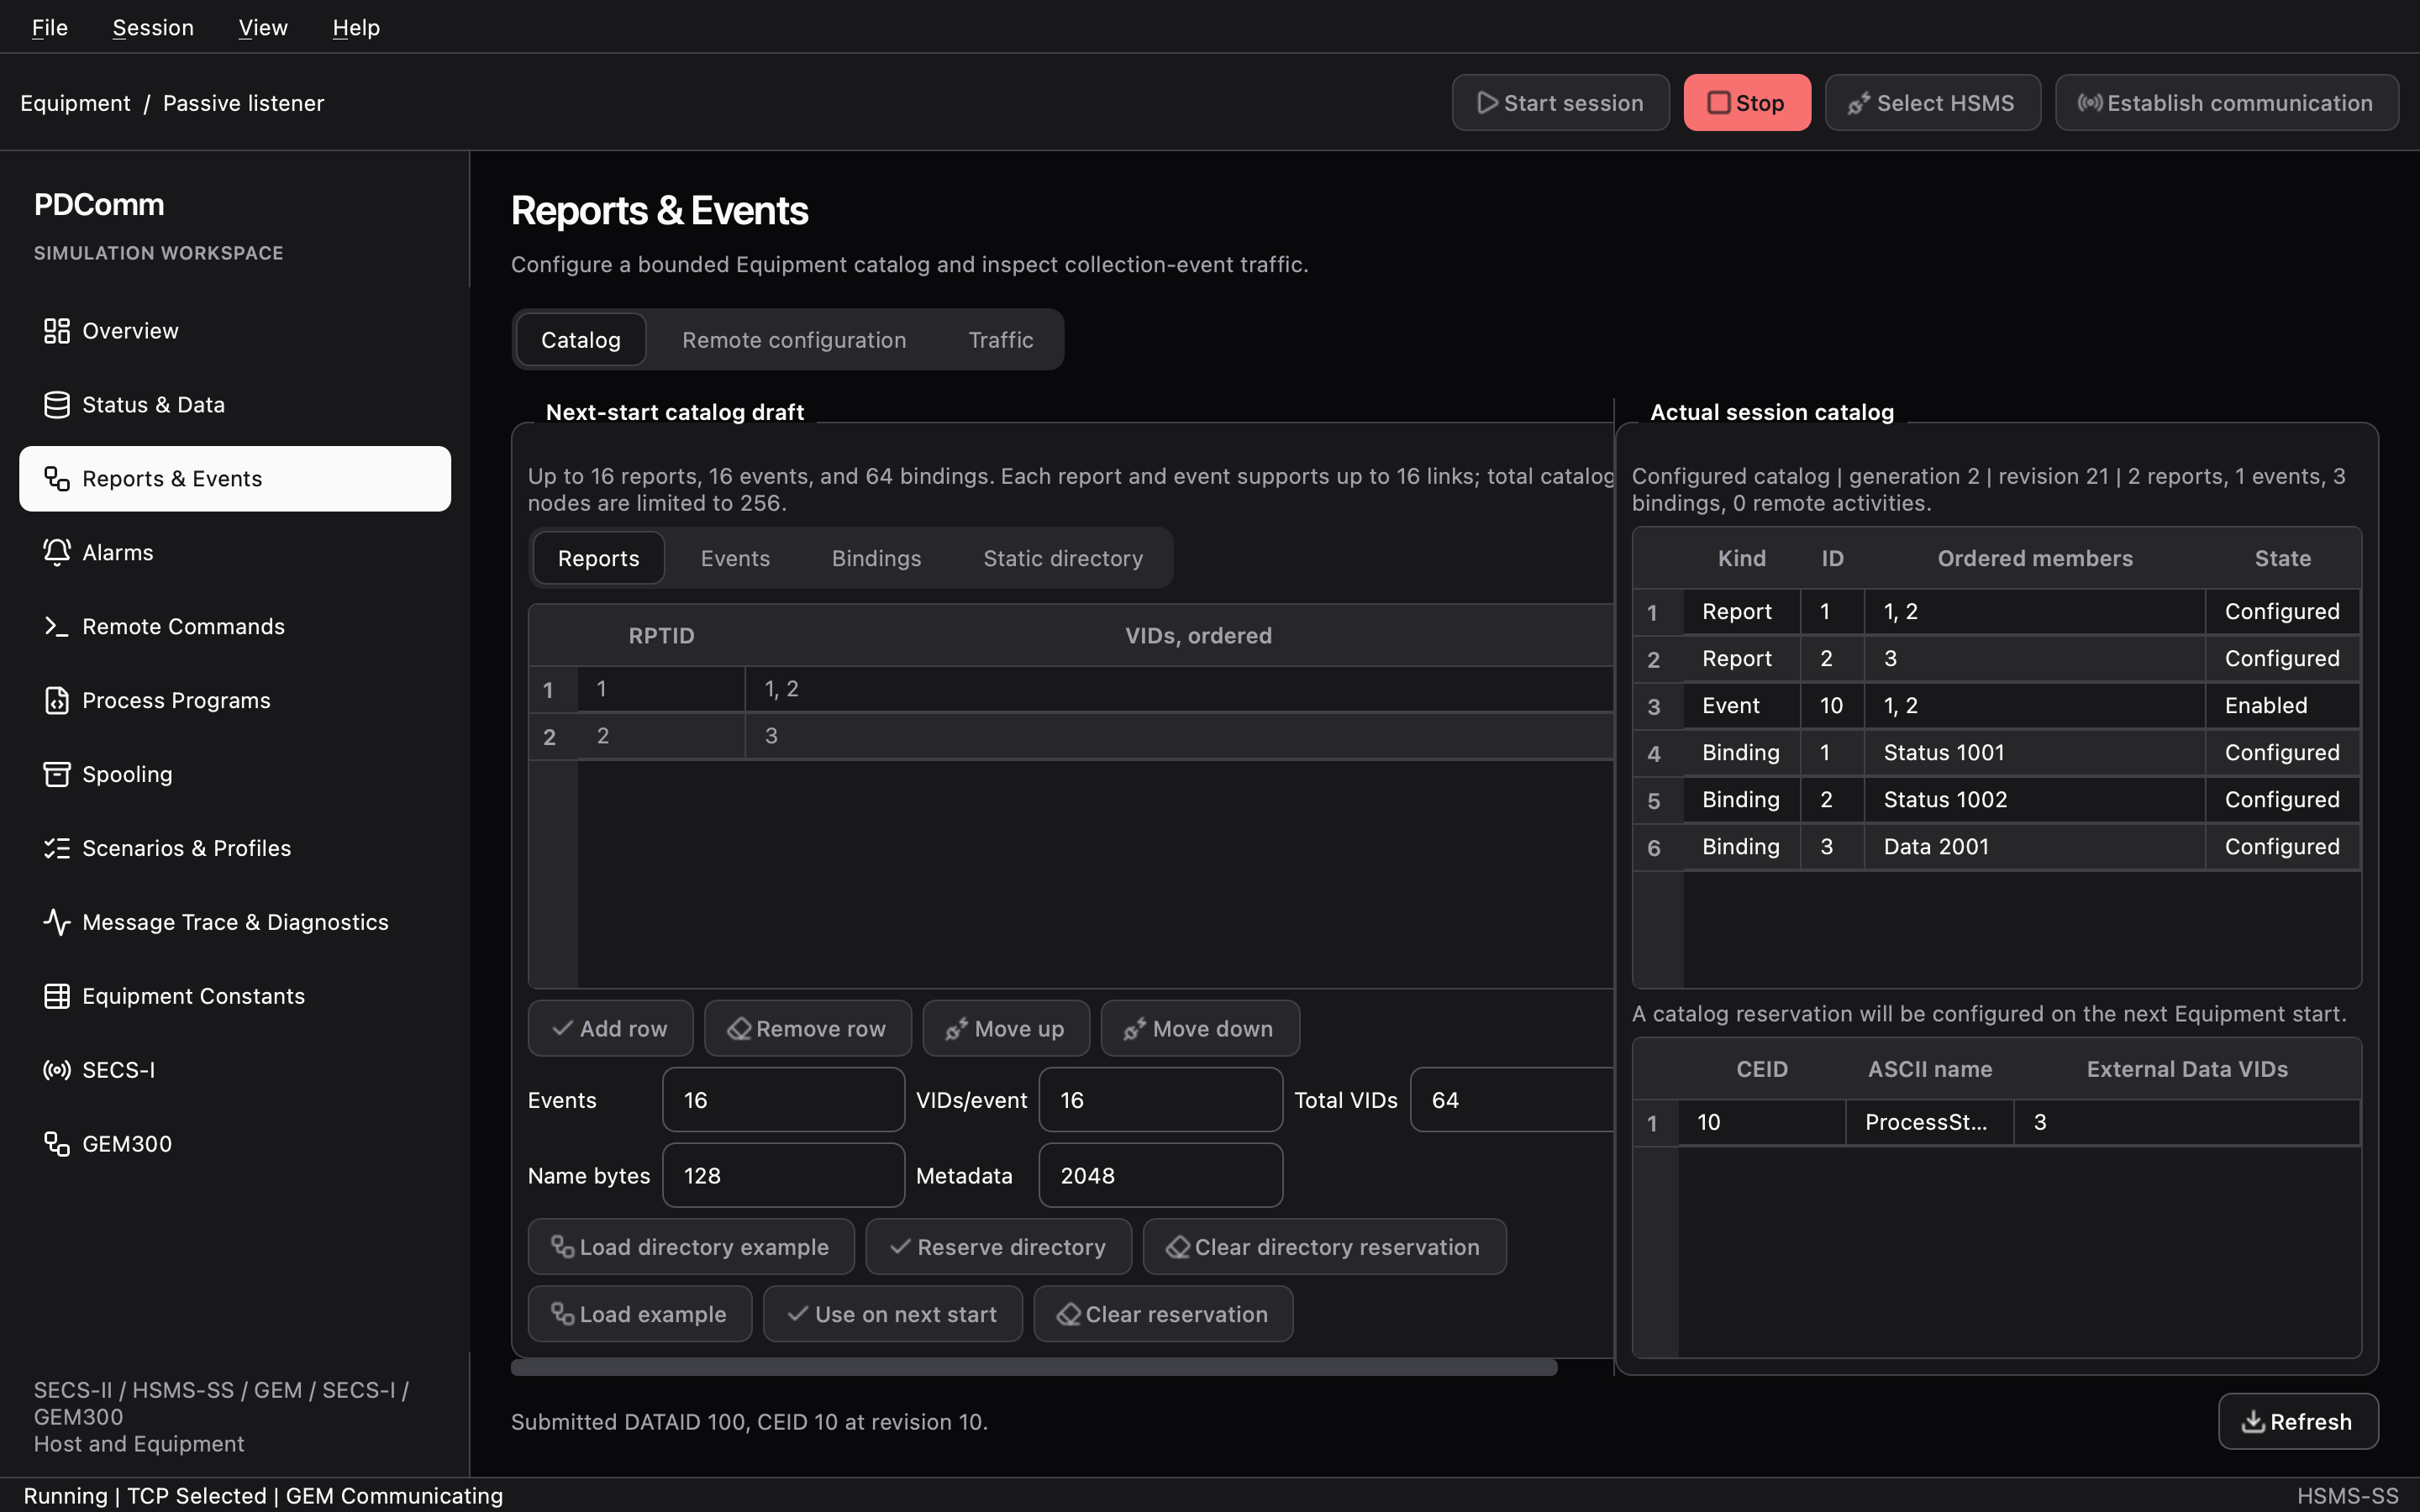
- Catalog (Equipment): edit the Reports, Events, Bindings, and Static directory tabs inside Next-start catalog draft. Load example adds RPTID
1(VIDs 1, 2), RPTID2(VID 3), CEID10(RPTIDs 1, 2, Enabled), and the VID bindings1→ Status 1001,2→ Status 1002, and3→ Data 2001. Load directory example adds CEID10namedProcessStarted. Reserve them with Use on next start and Reserve directory. - Remote configuration (Host): enter a DATAID and configure the Equipment remotely with Define reports (S2F33), Link reports (S2F35), and Apply event state (S2F37).
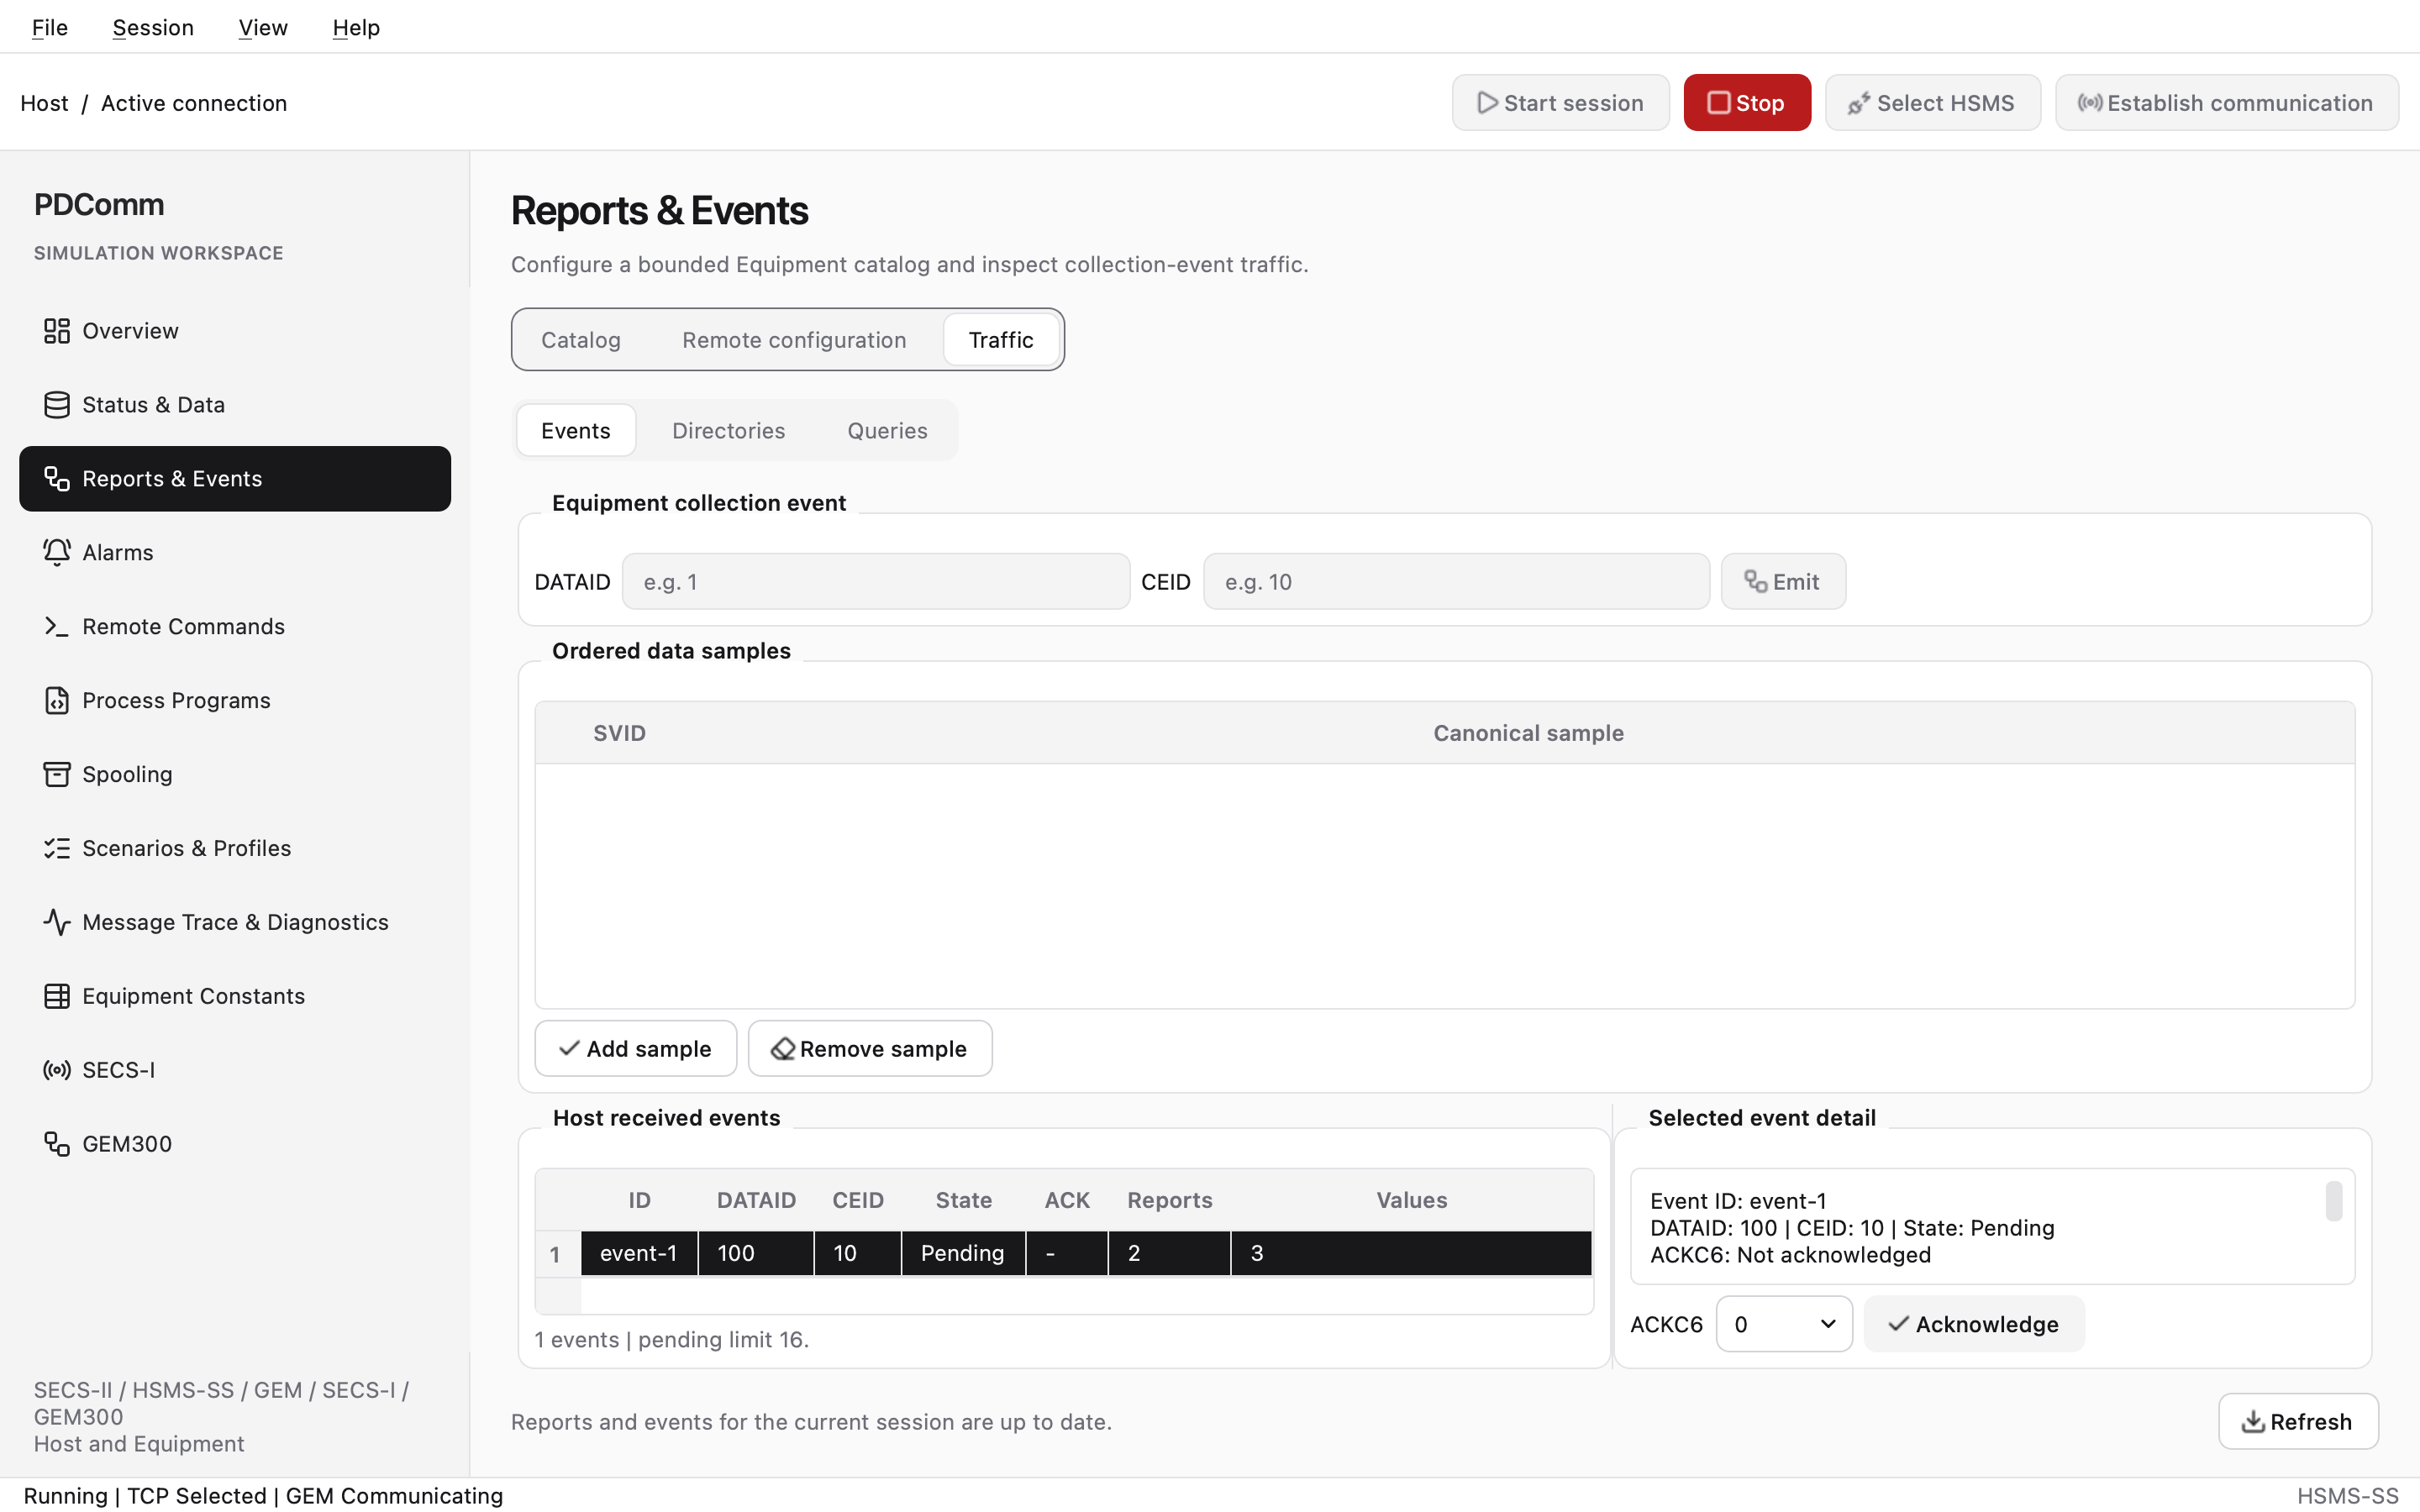
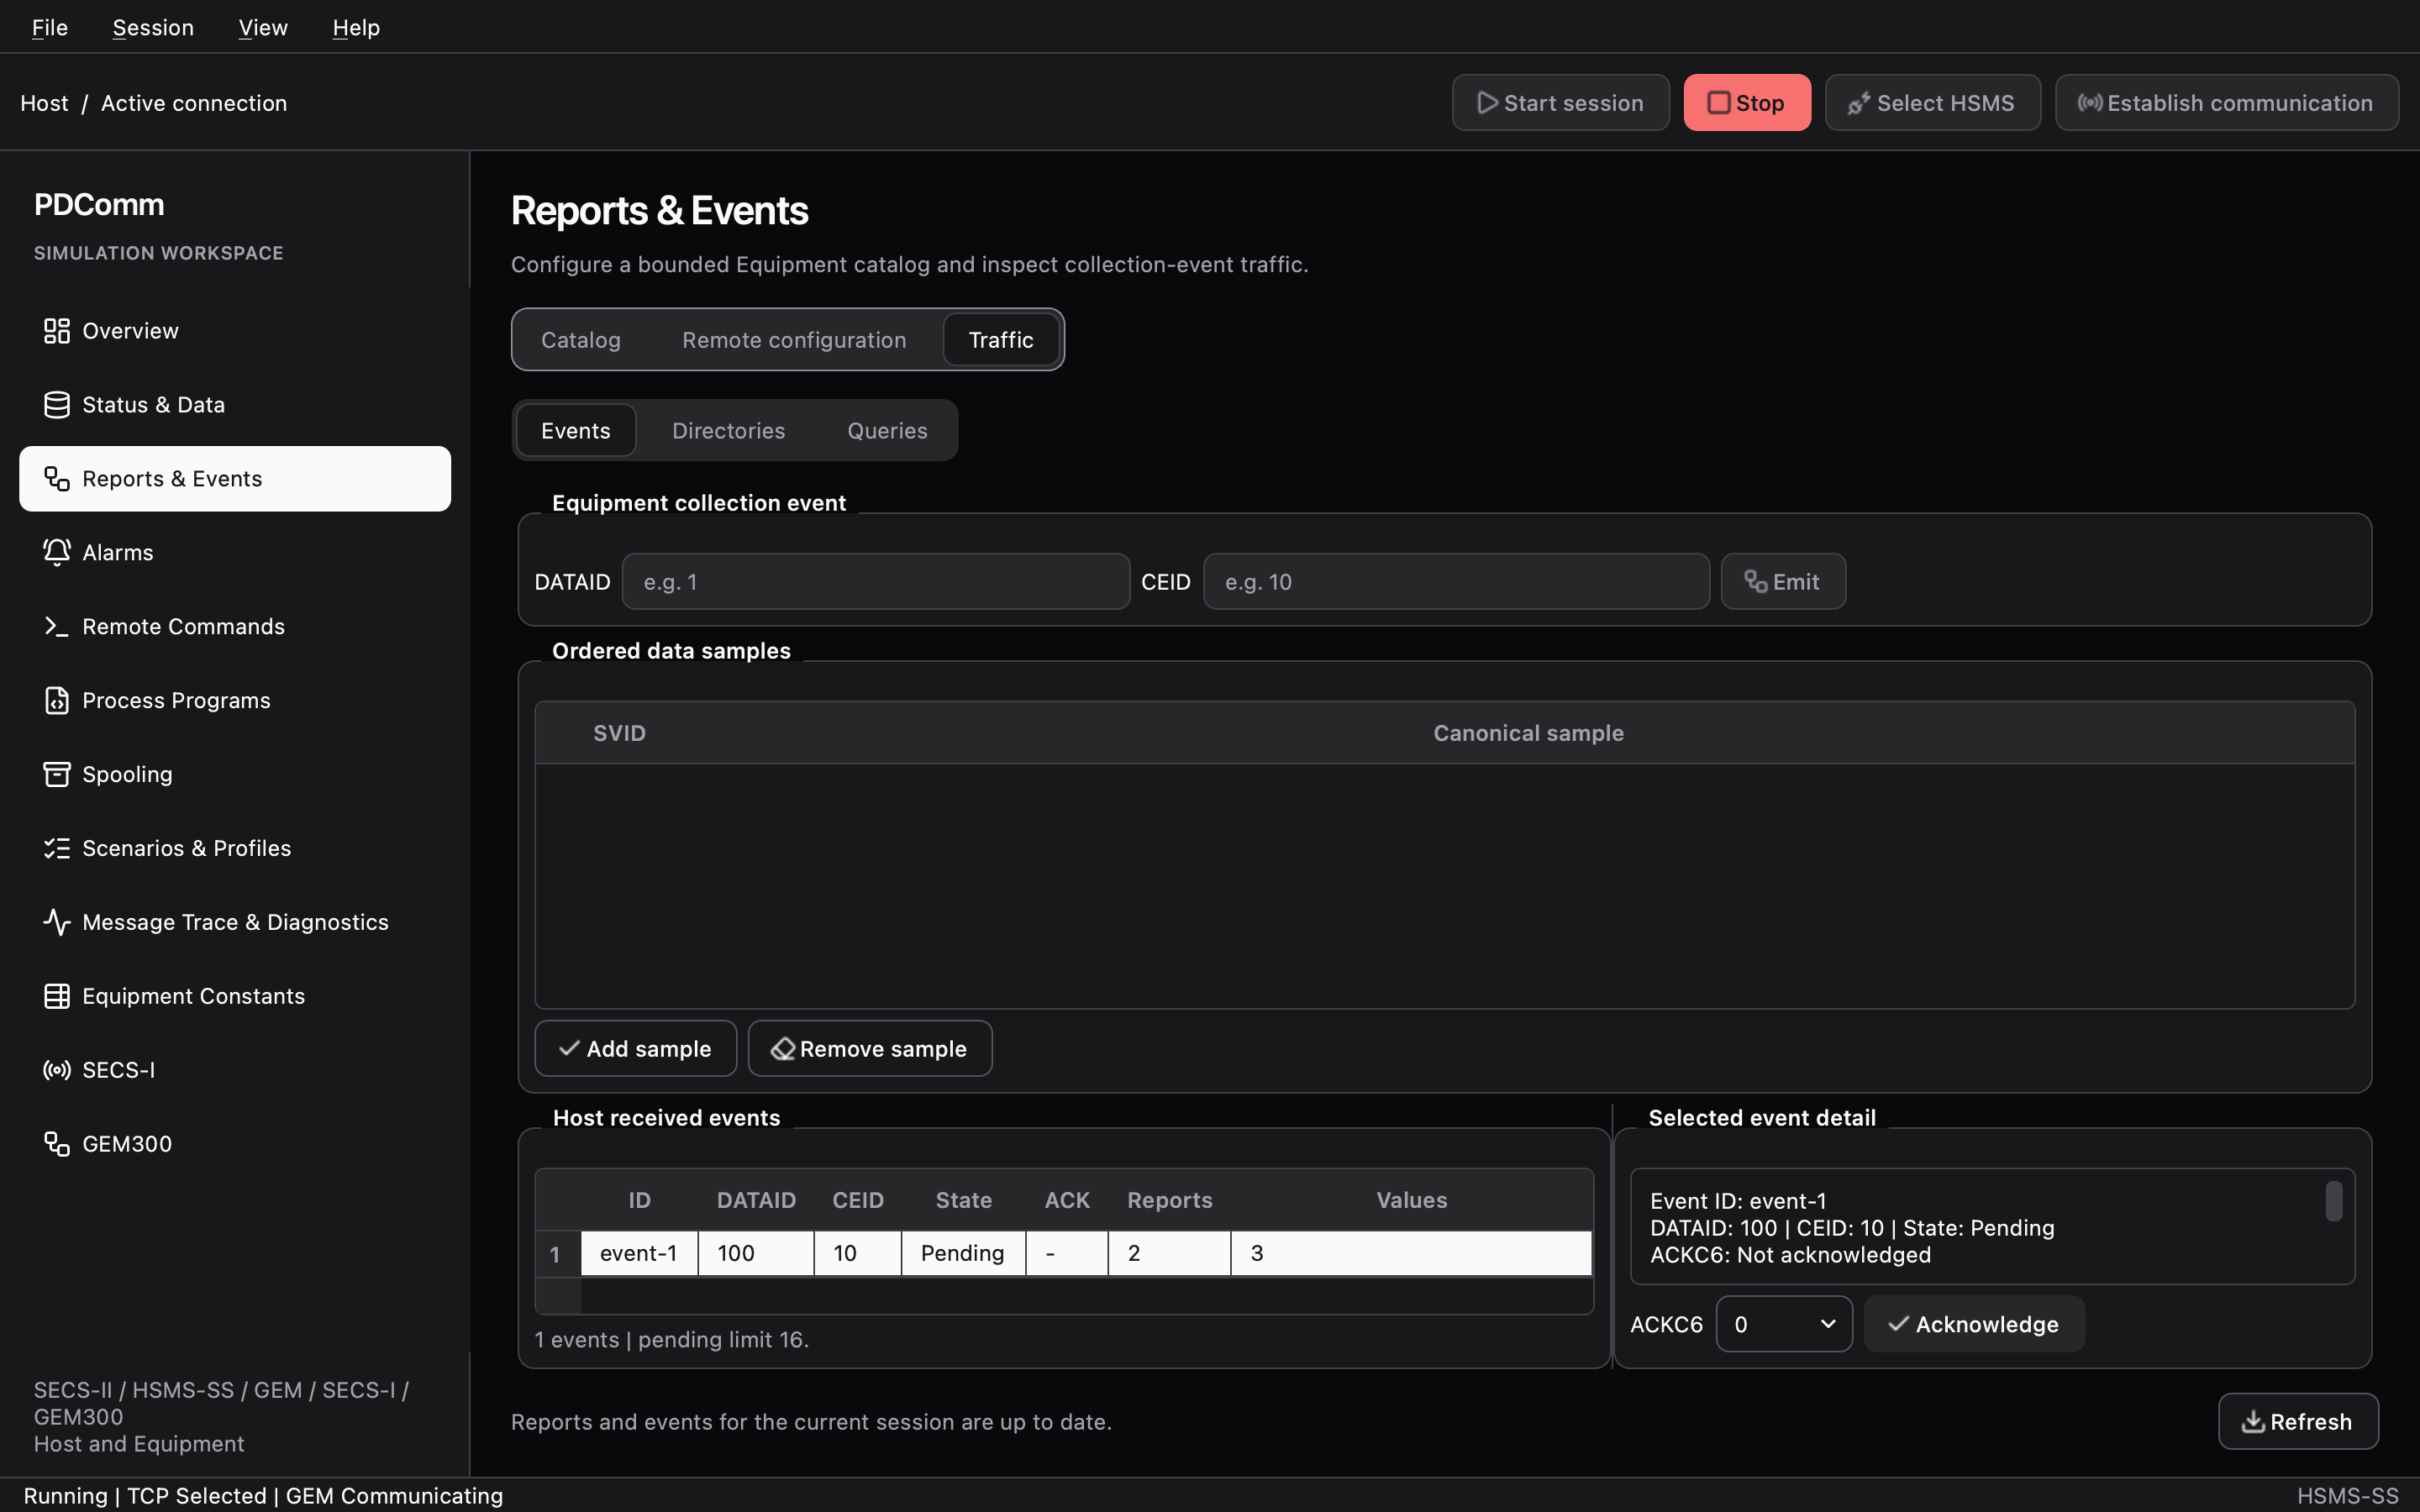
- Traffic: the inner tabs are Events, Directories, and Queries. The Equipment enters a DATAID and CEID and clicks Emit to send S6F11. The Host selects an event under Host received events, picks ACKC6, and clicks Acknowledge. Read event directory and Submit query live here too.
Emit is enabled only while the Equipment is communicating and its session has a configured catalog.
Walkthrough: Reports and events
Alarms
Section titled “Alarms”The tabs are Catalog and Traffic.
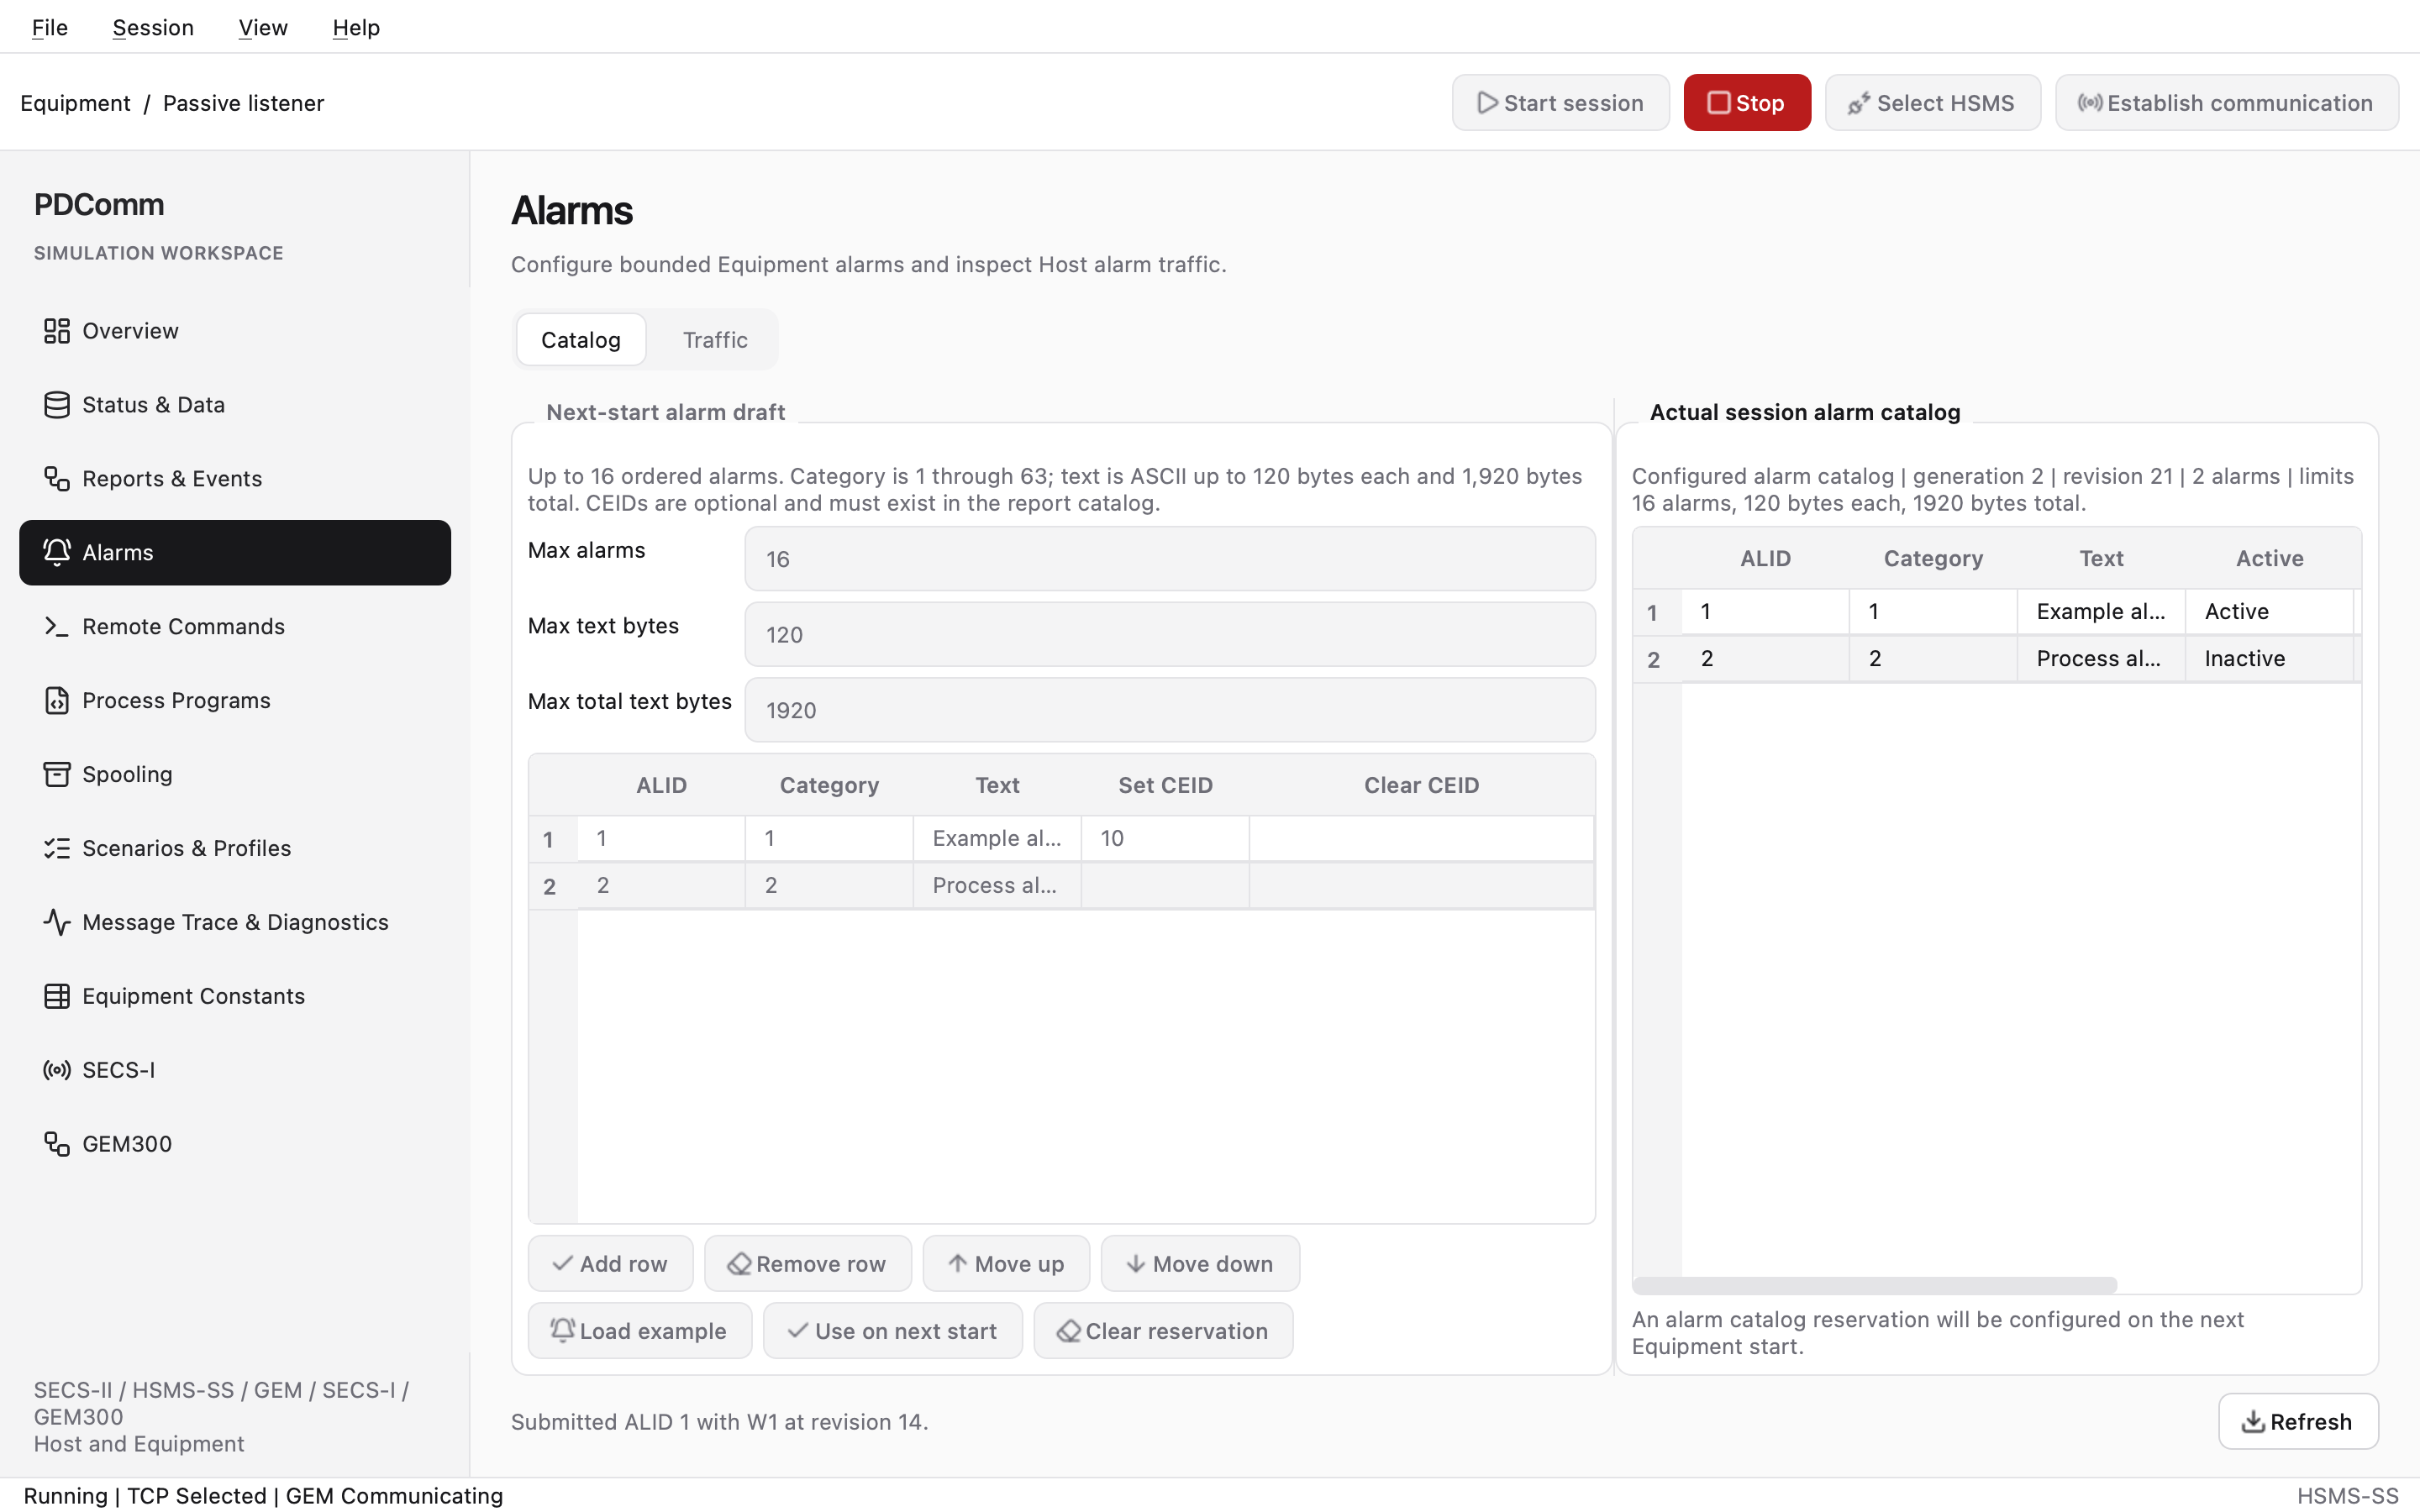
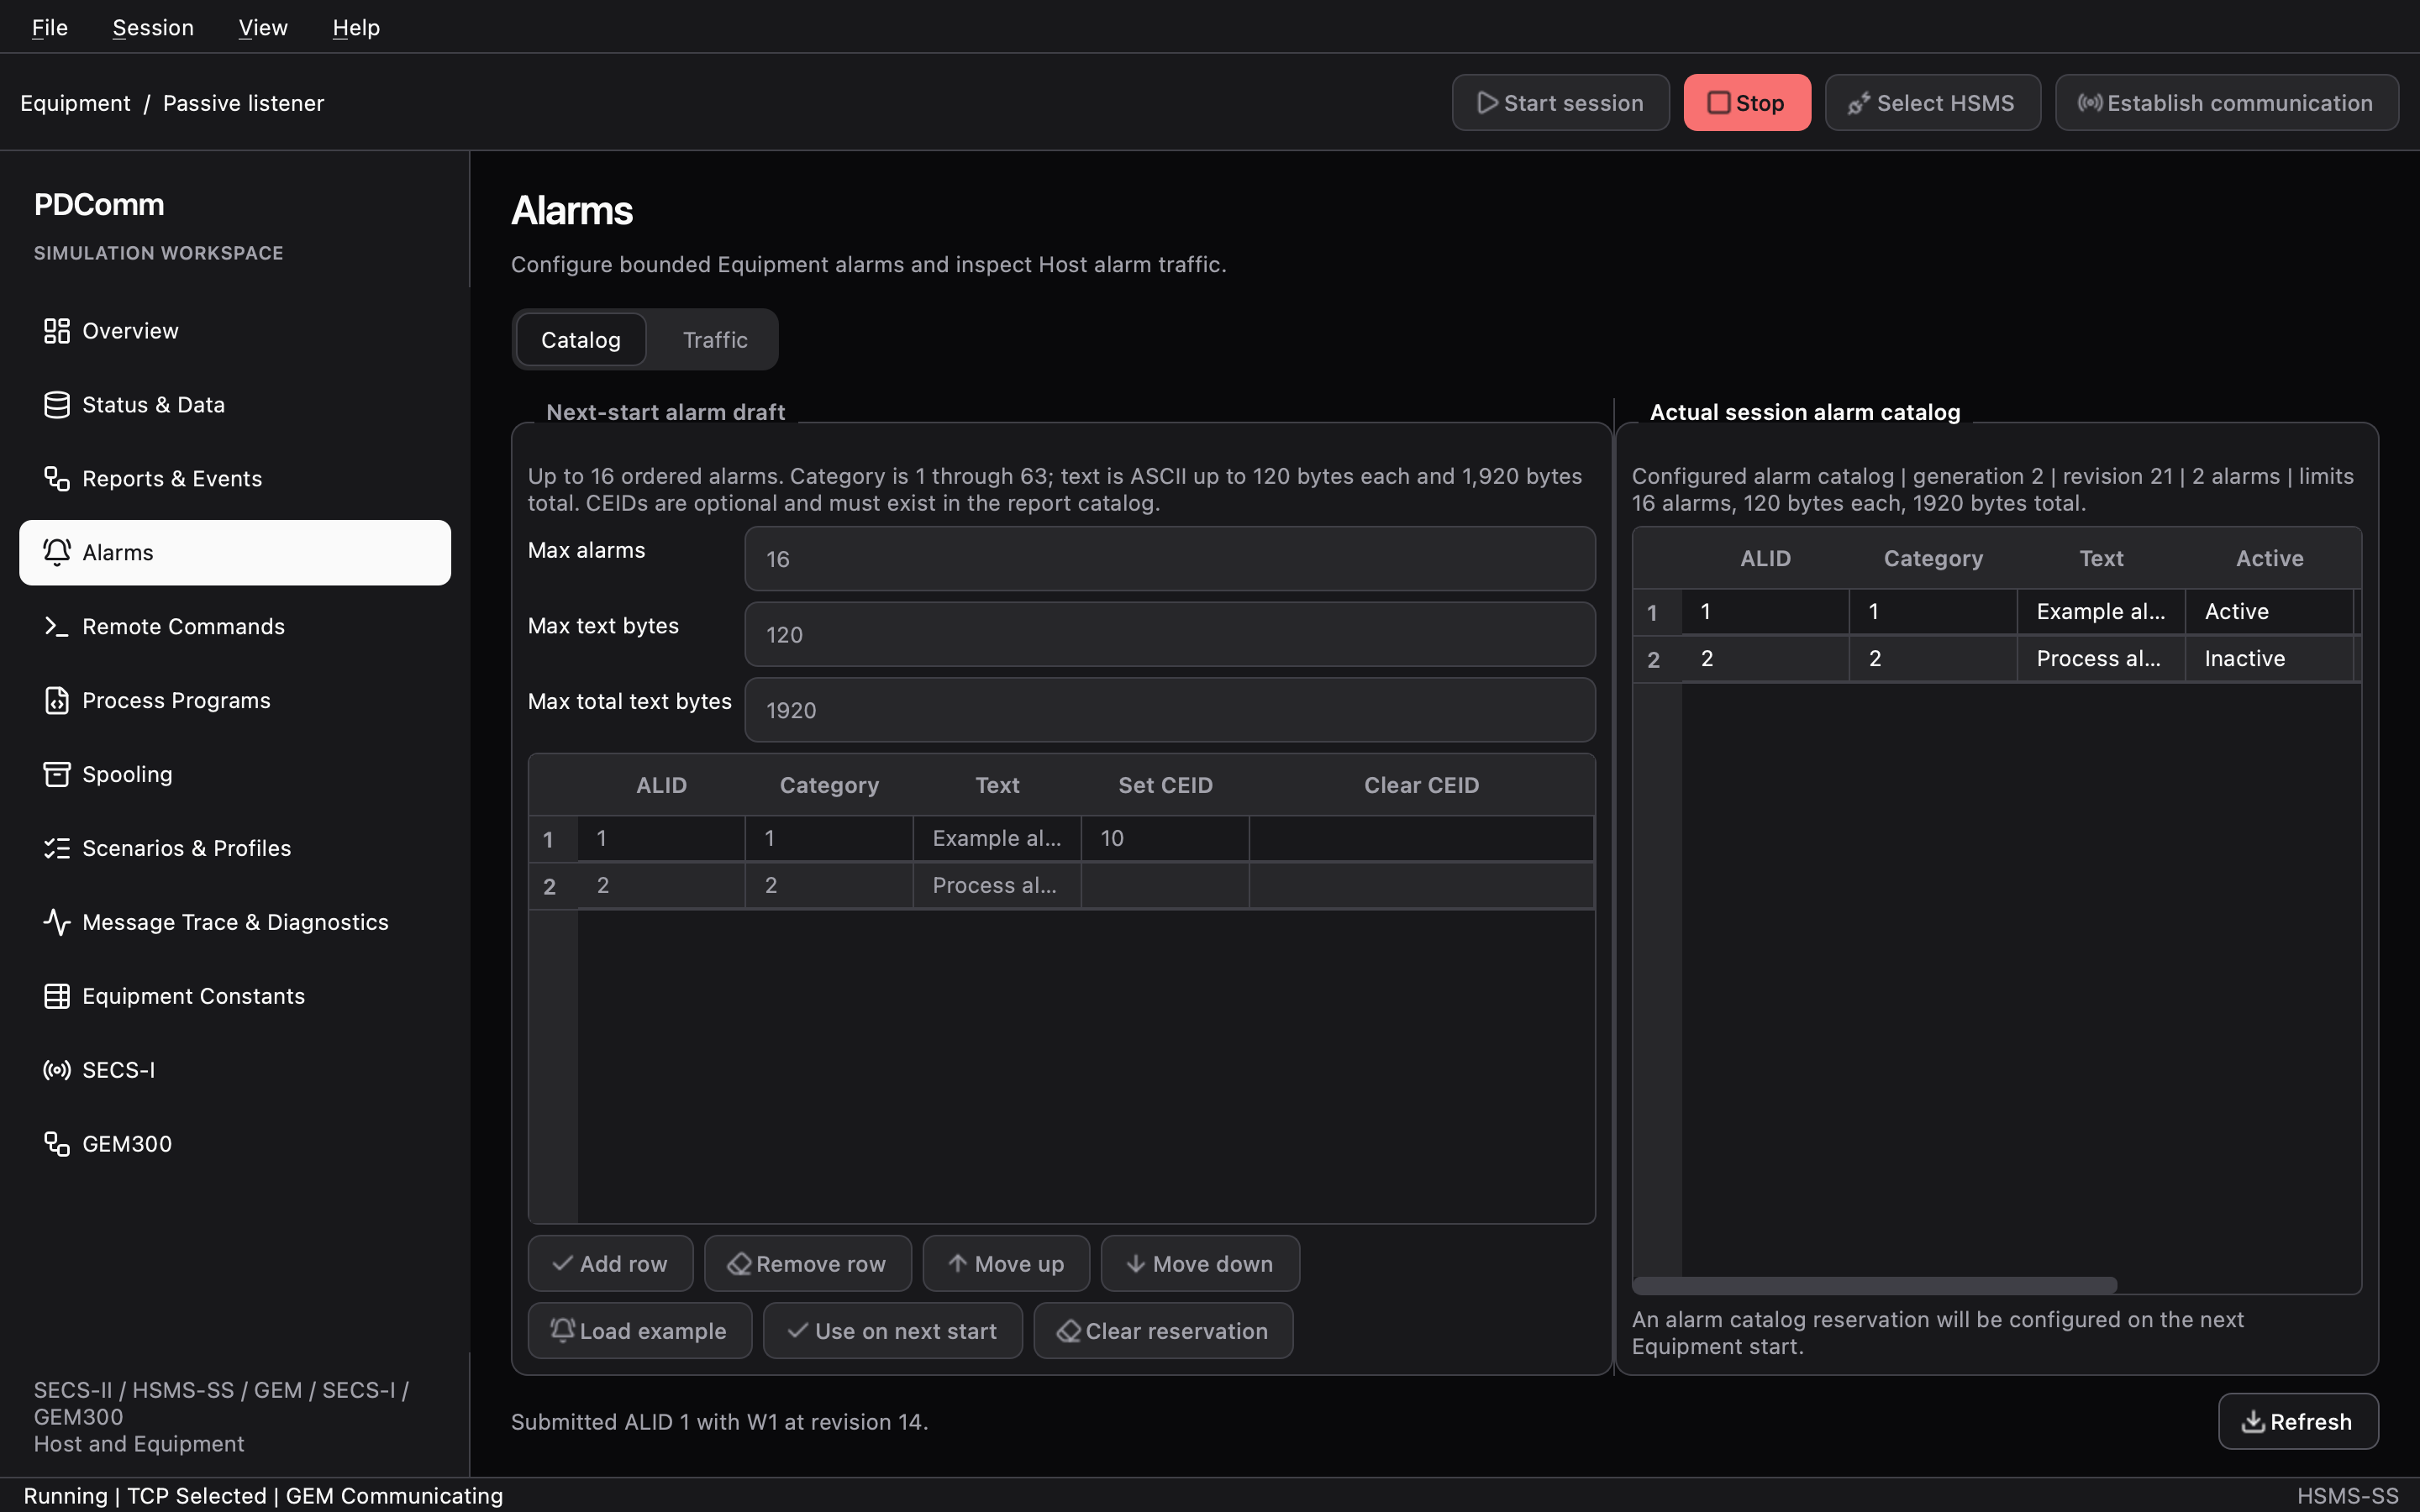
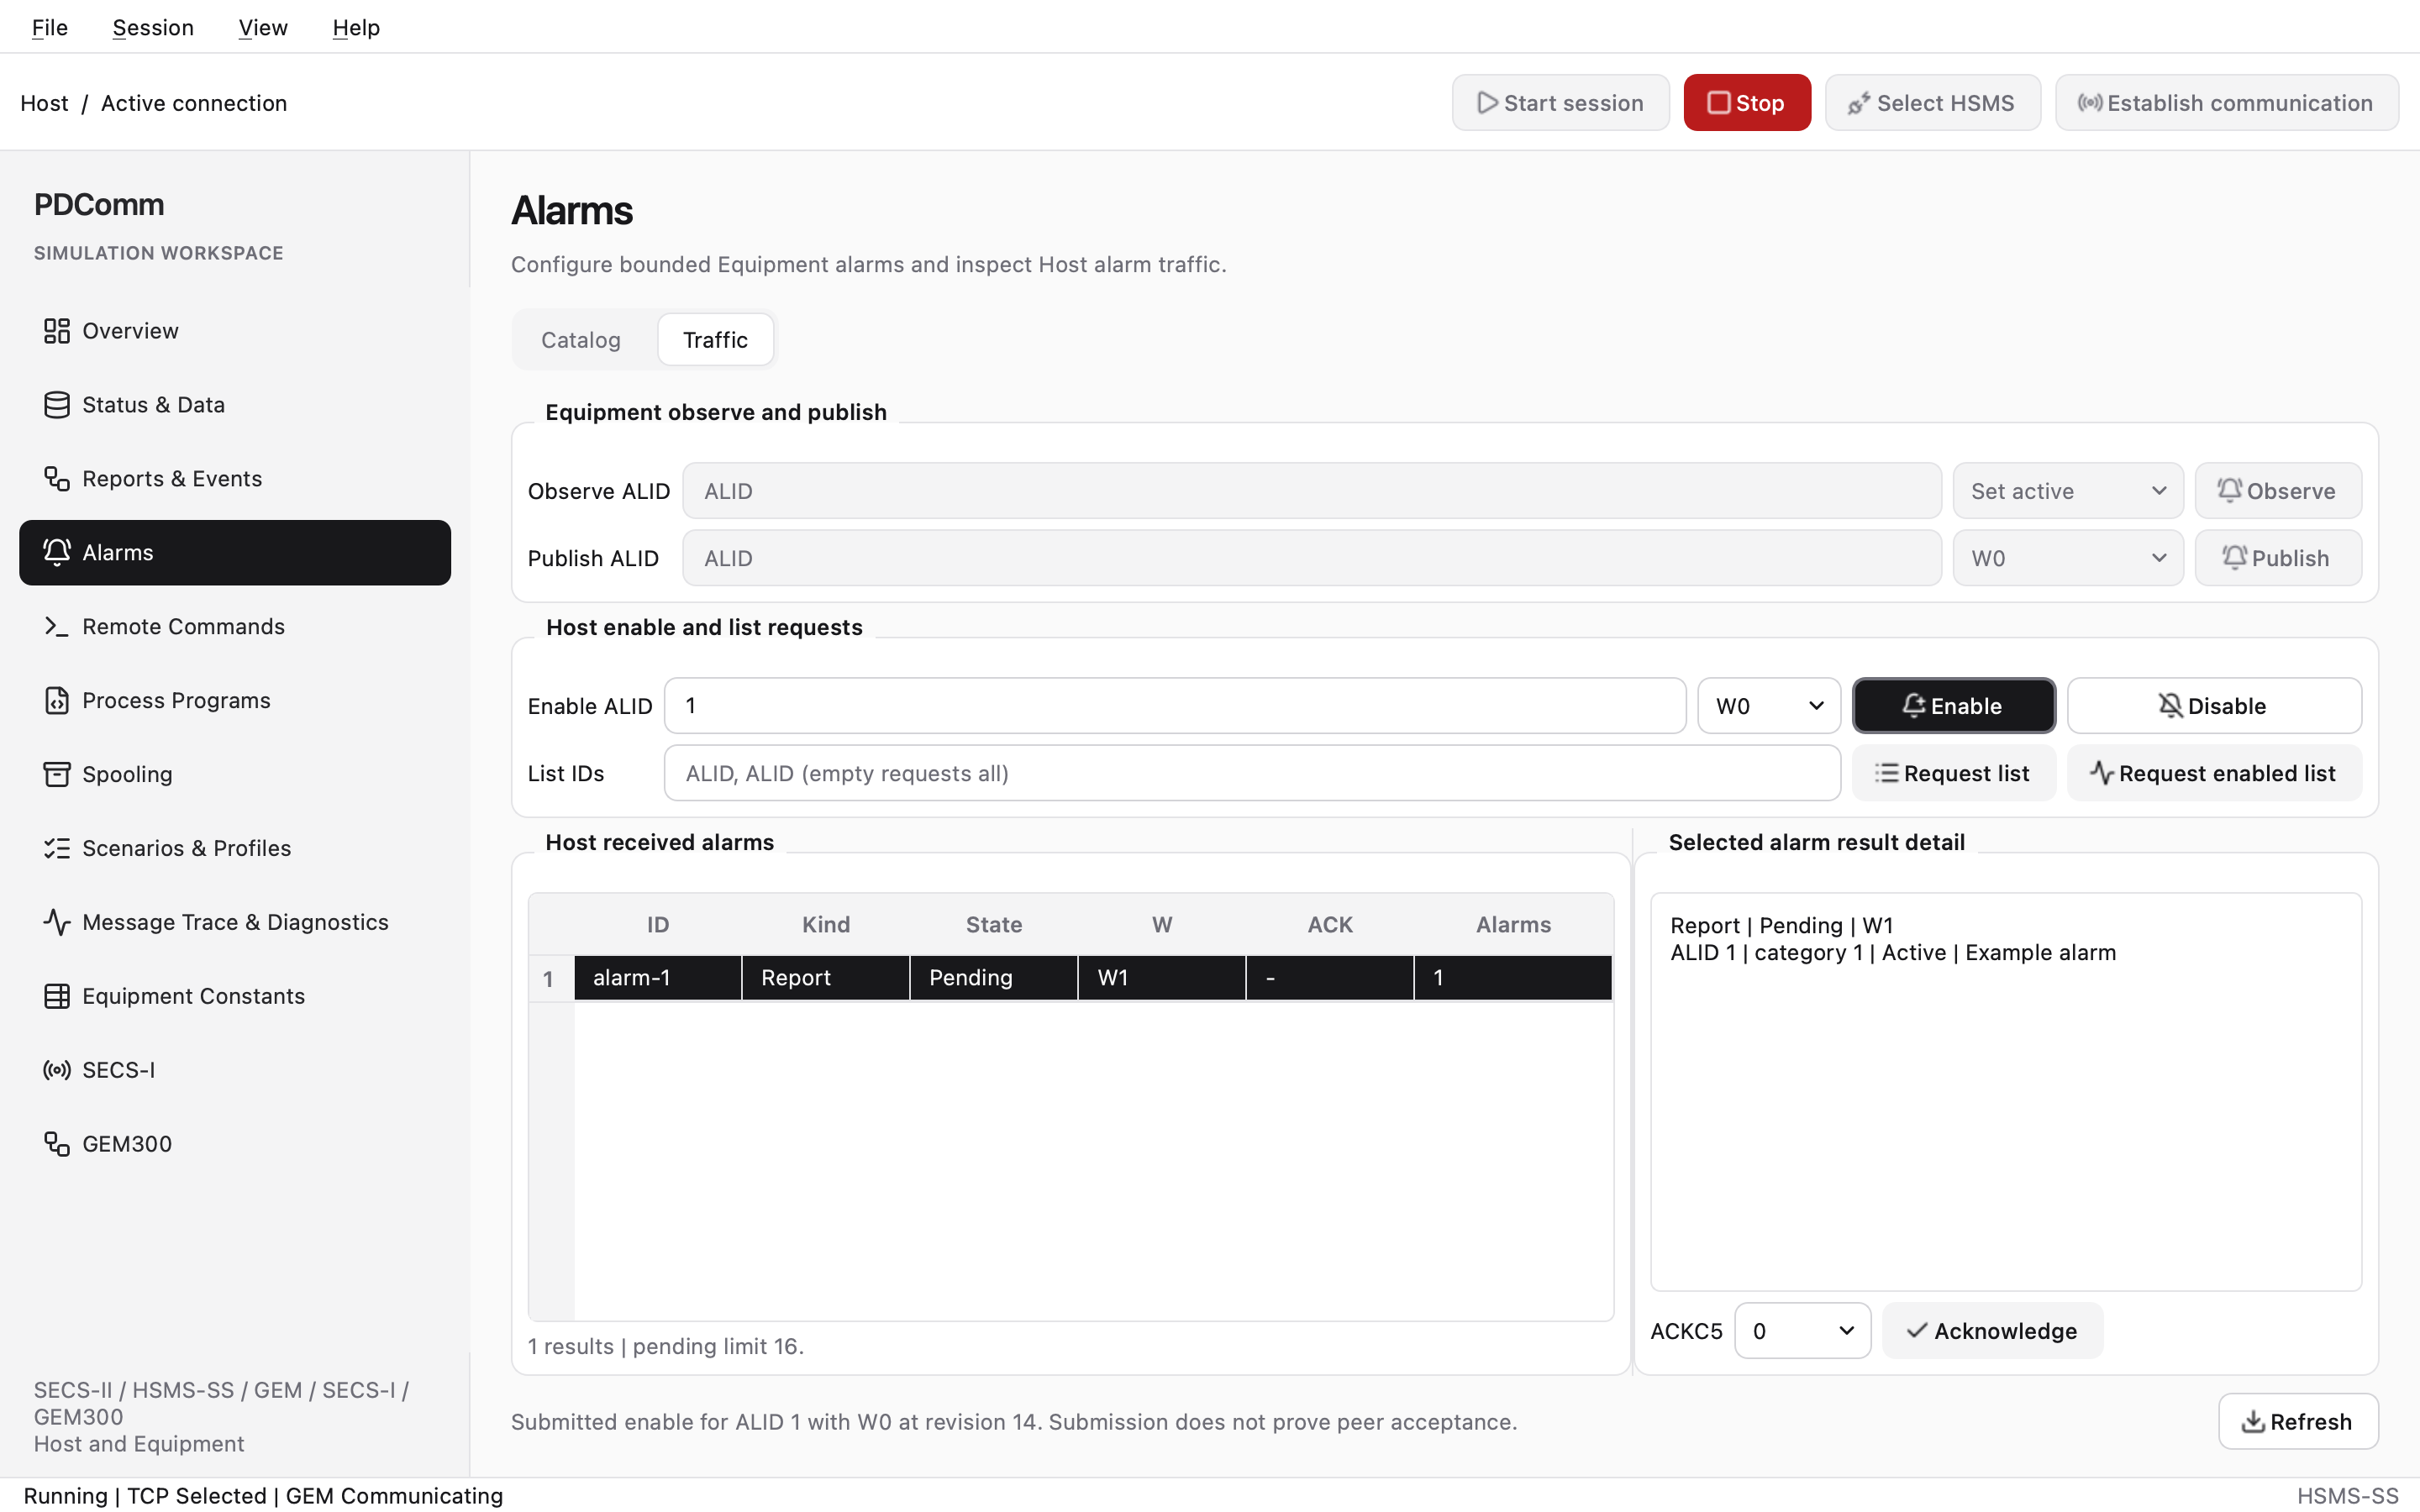
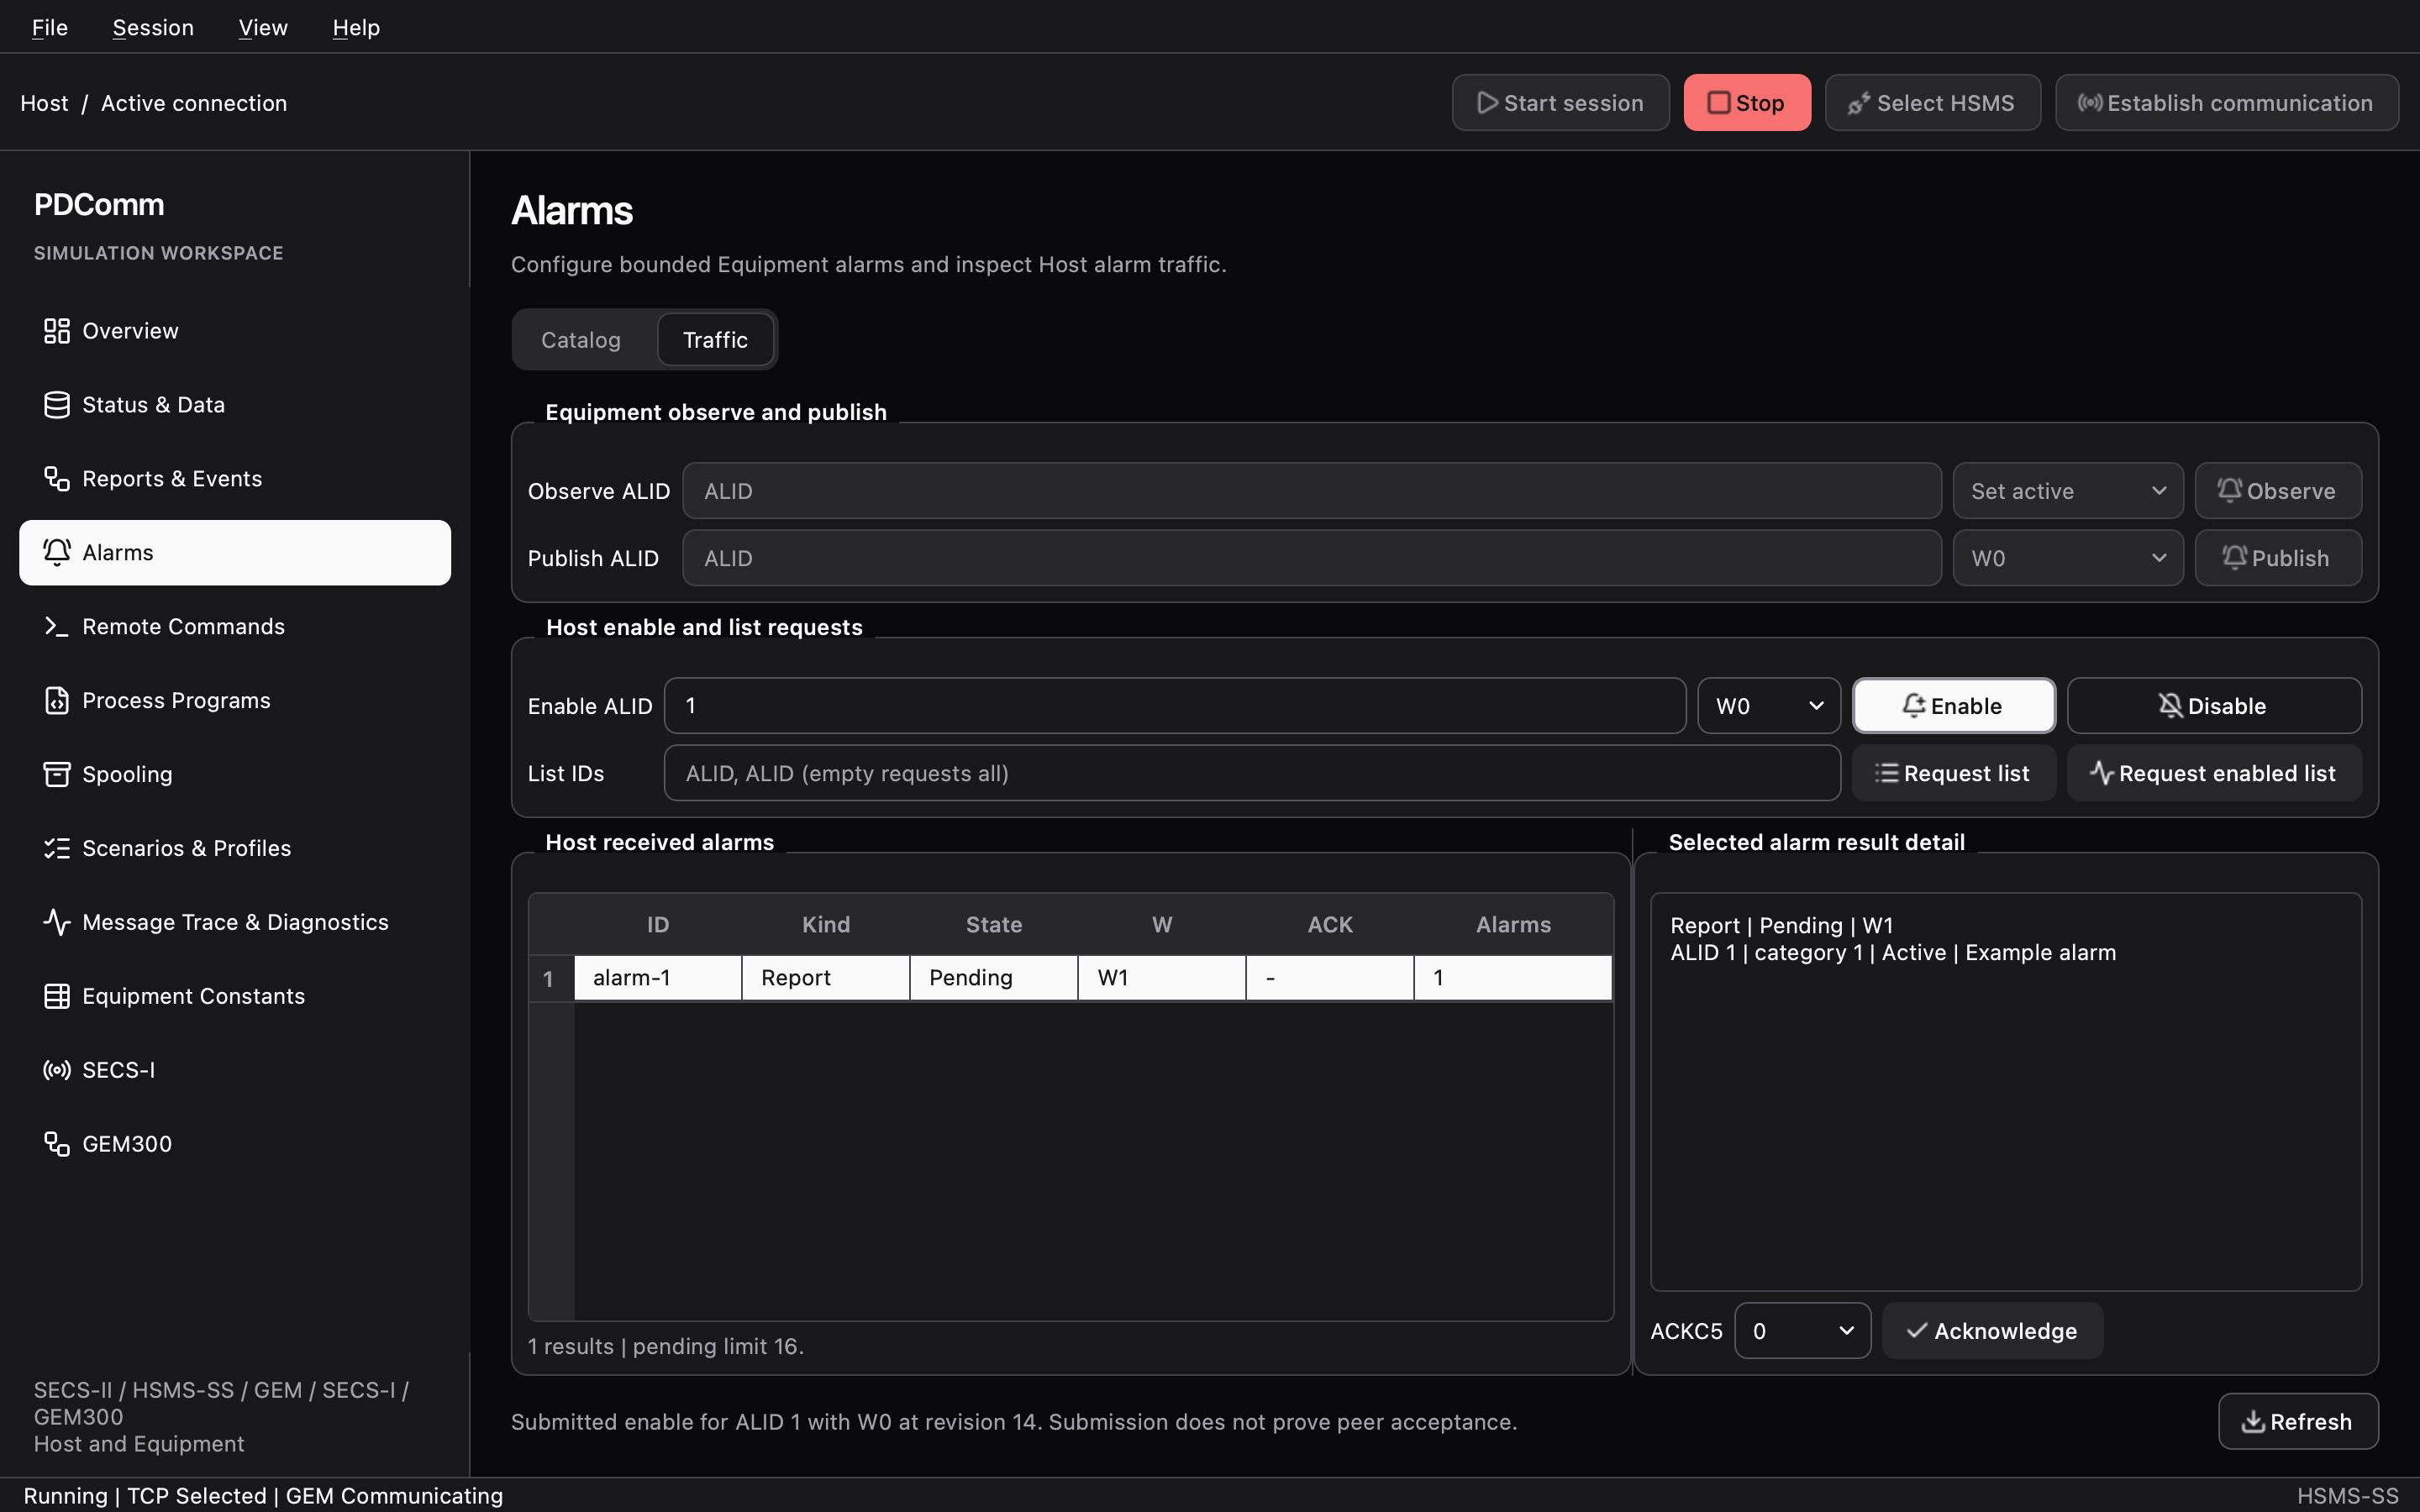
- Catalog (Equipment): in Next-start alarm draft, edit ALID, Category (1–63), Text (ASCII, up to 120 bytes), Set CEID, and Clear CEID. Load example adds ALID
1(category 1,Example alarm, set CEID 10, clear CEID 11) and ALID2(category 2,Process alarm). - Traffic: on the Equipment, Observe ALID changes only the local alarm state (Set active or Clear active, nothing is sent), and Publish ALID sends the current state as S5F1 (W0 or W1). On the Host, use Enable ALID with Enable or Disable (S5F3), Request list (S5F5), and Request enabled list (S5F7). Answer a received W1 alarm by picking ACKC5 and clicking Acknowledge.
Observe alone sends nothing. Publish works only after the Host has enabled reporting for that alarm.
Walkthrough: Alarms
Remote Commands
Section titled “Remote Commands”The tabs are Catalog and Traffic.
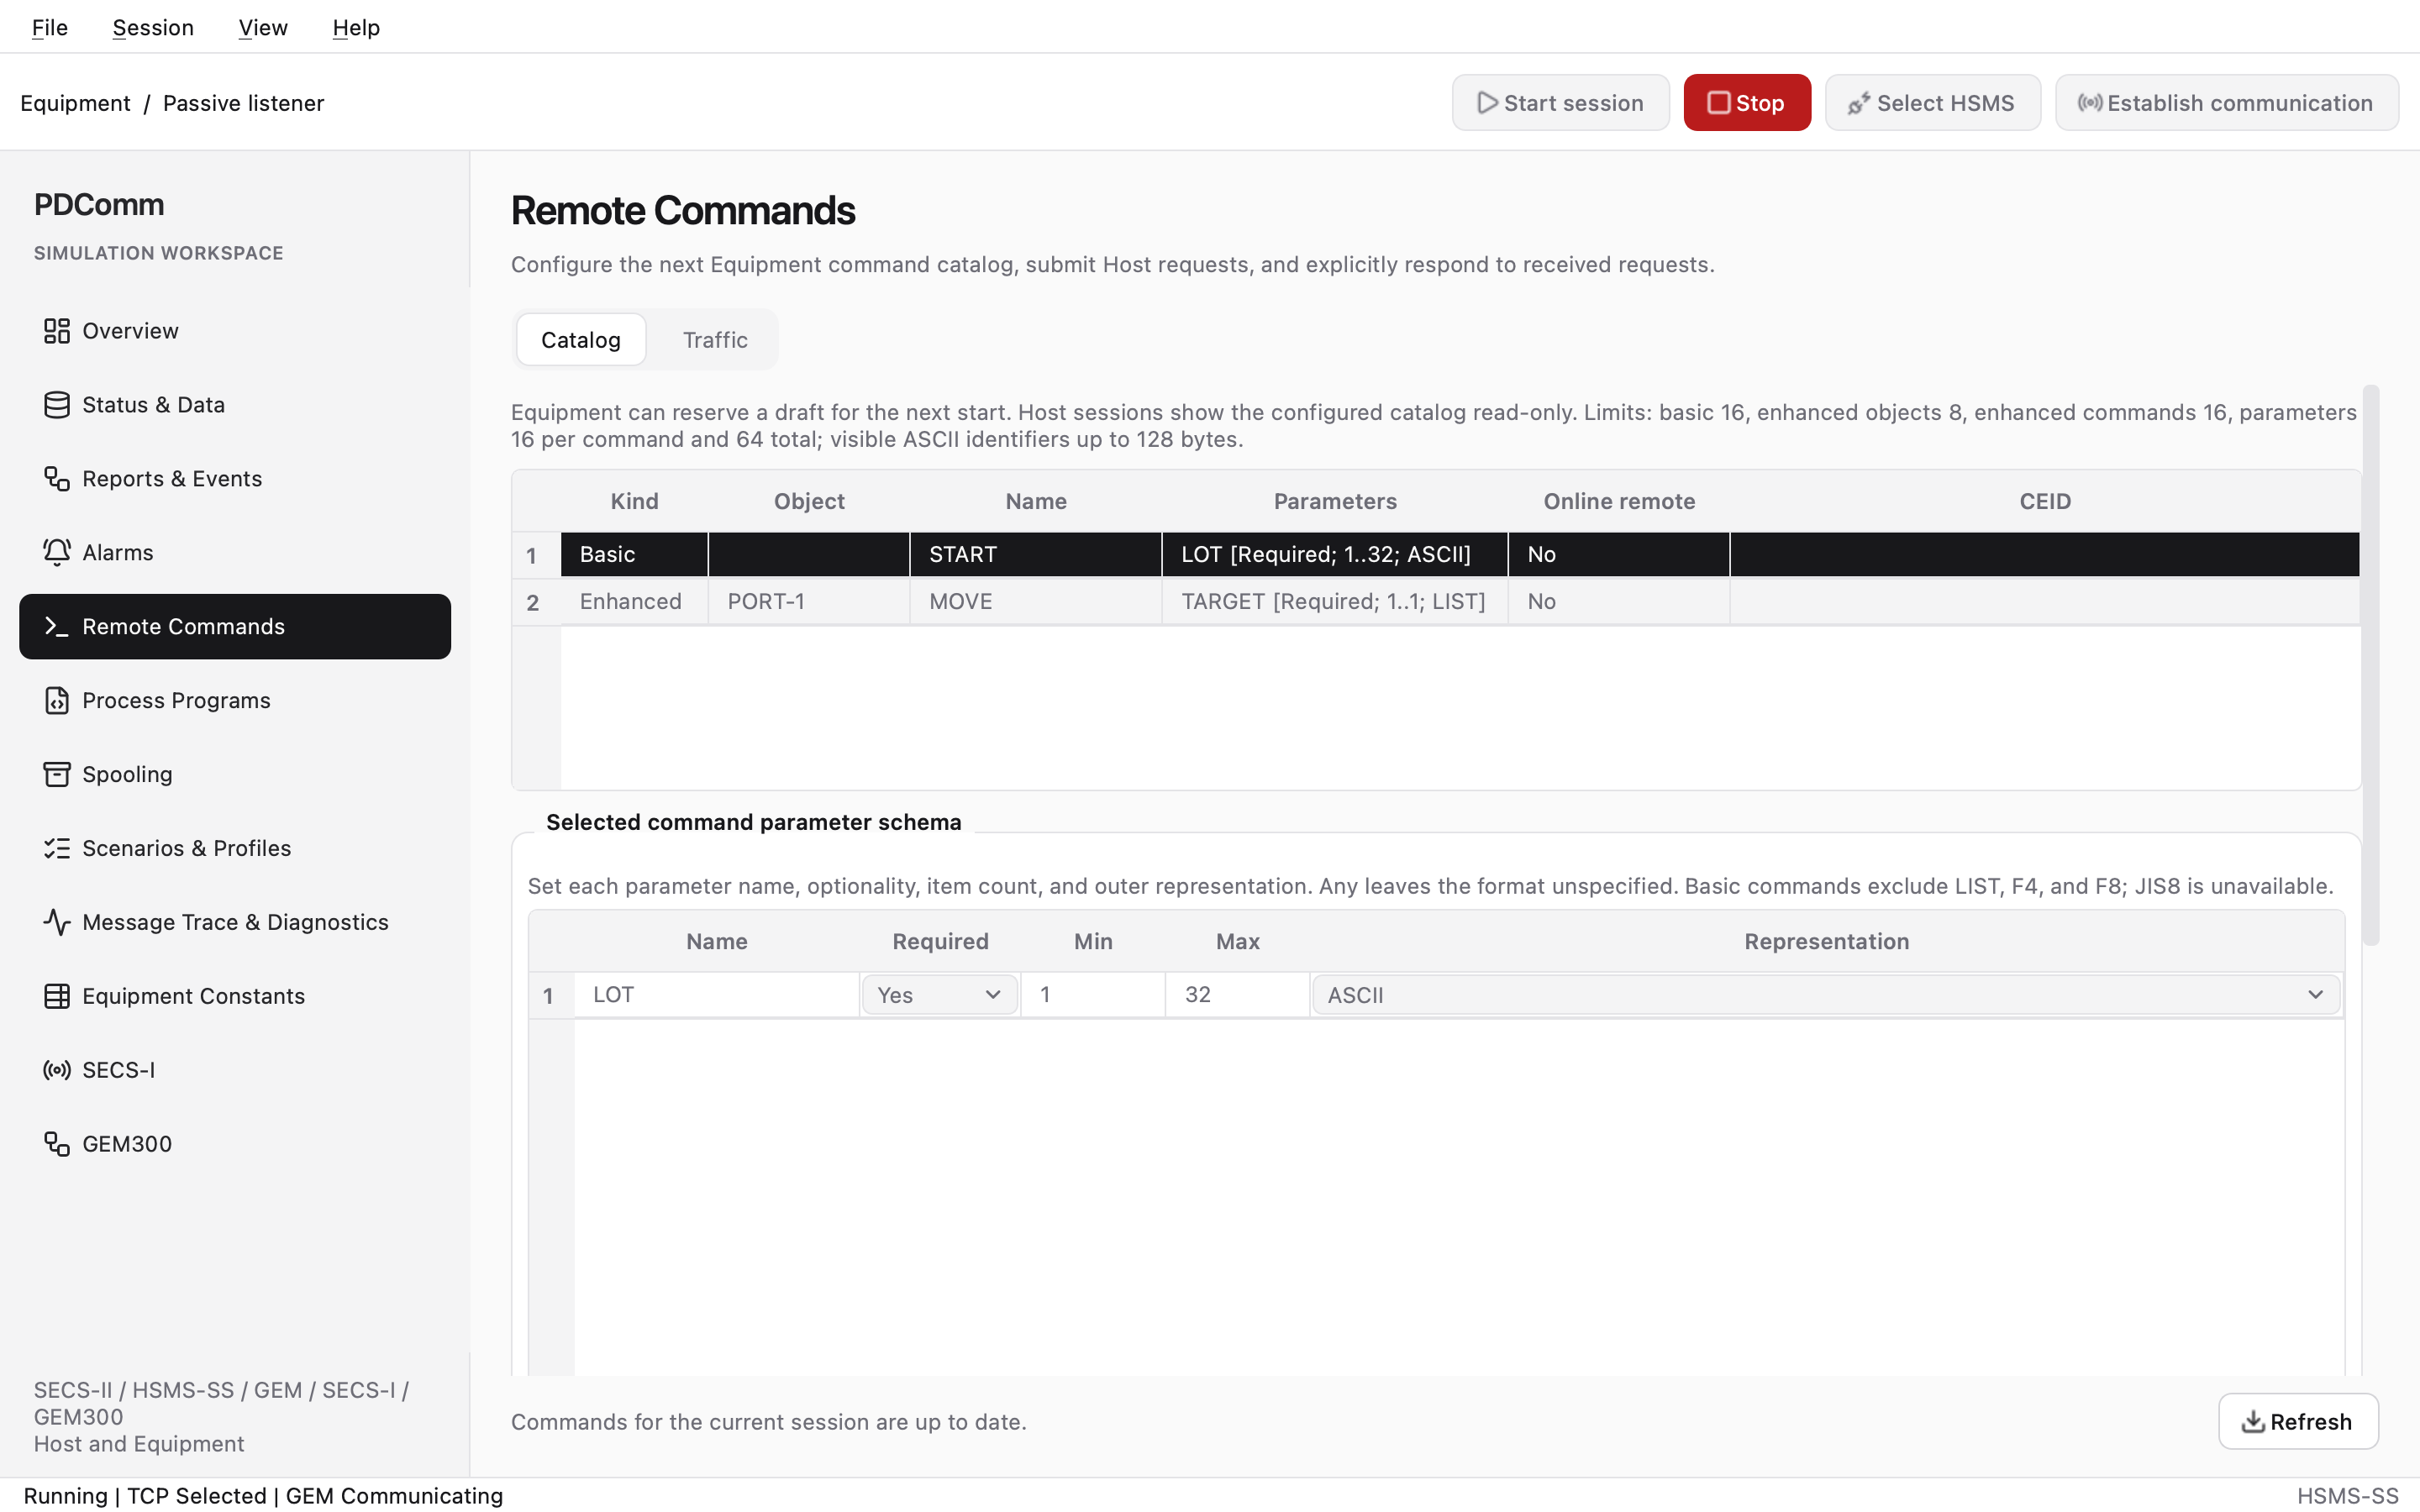
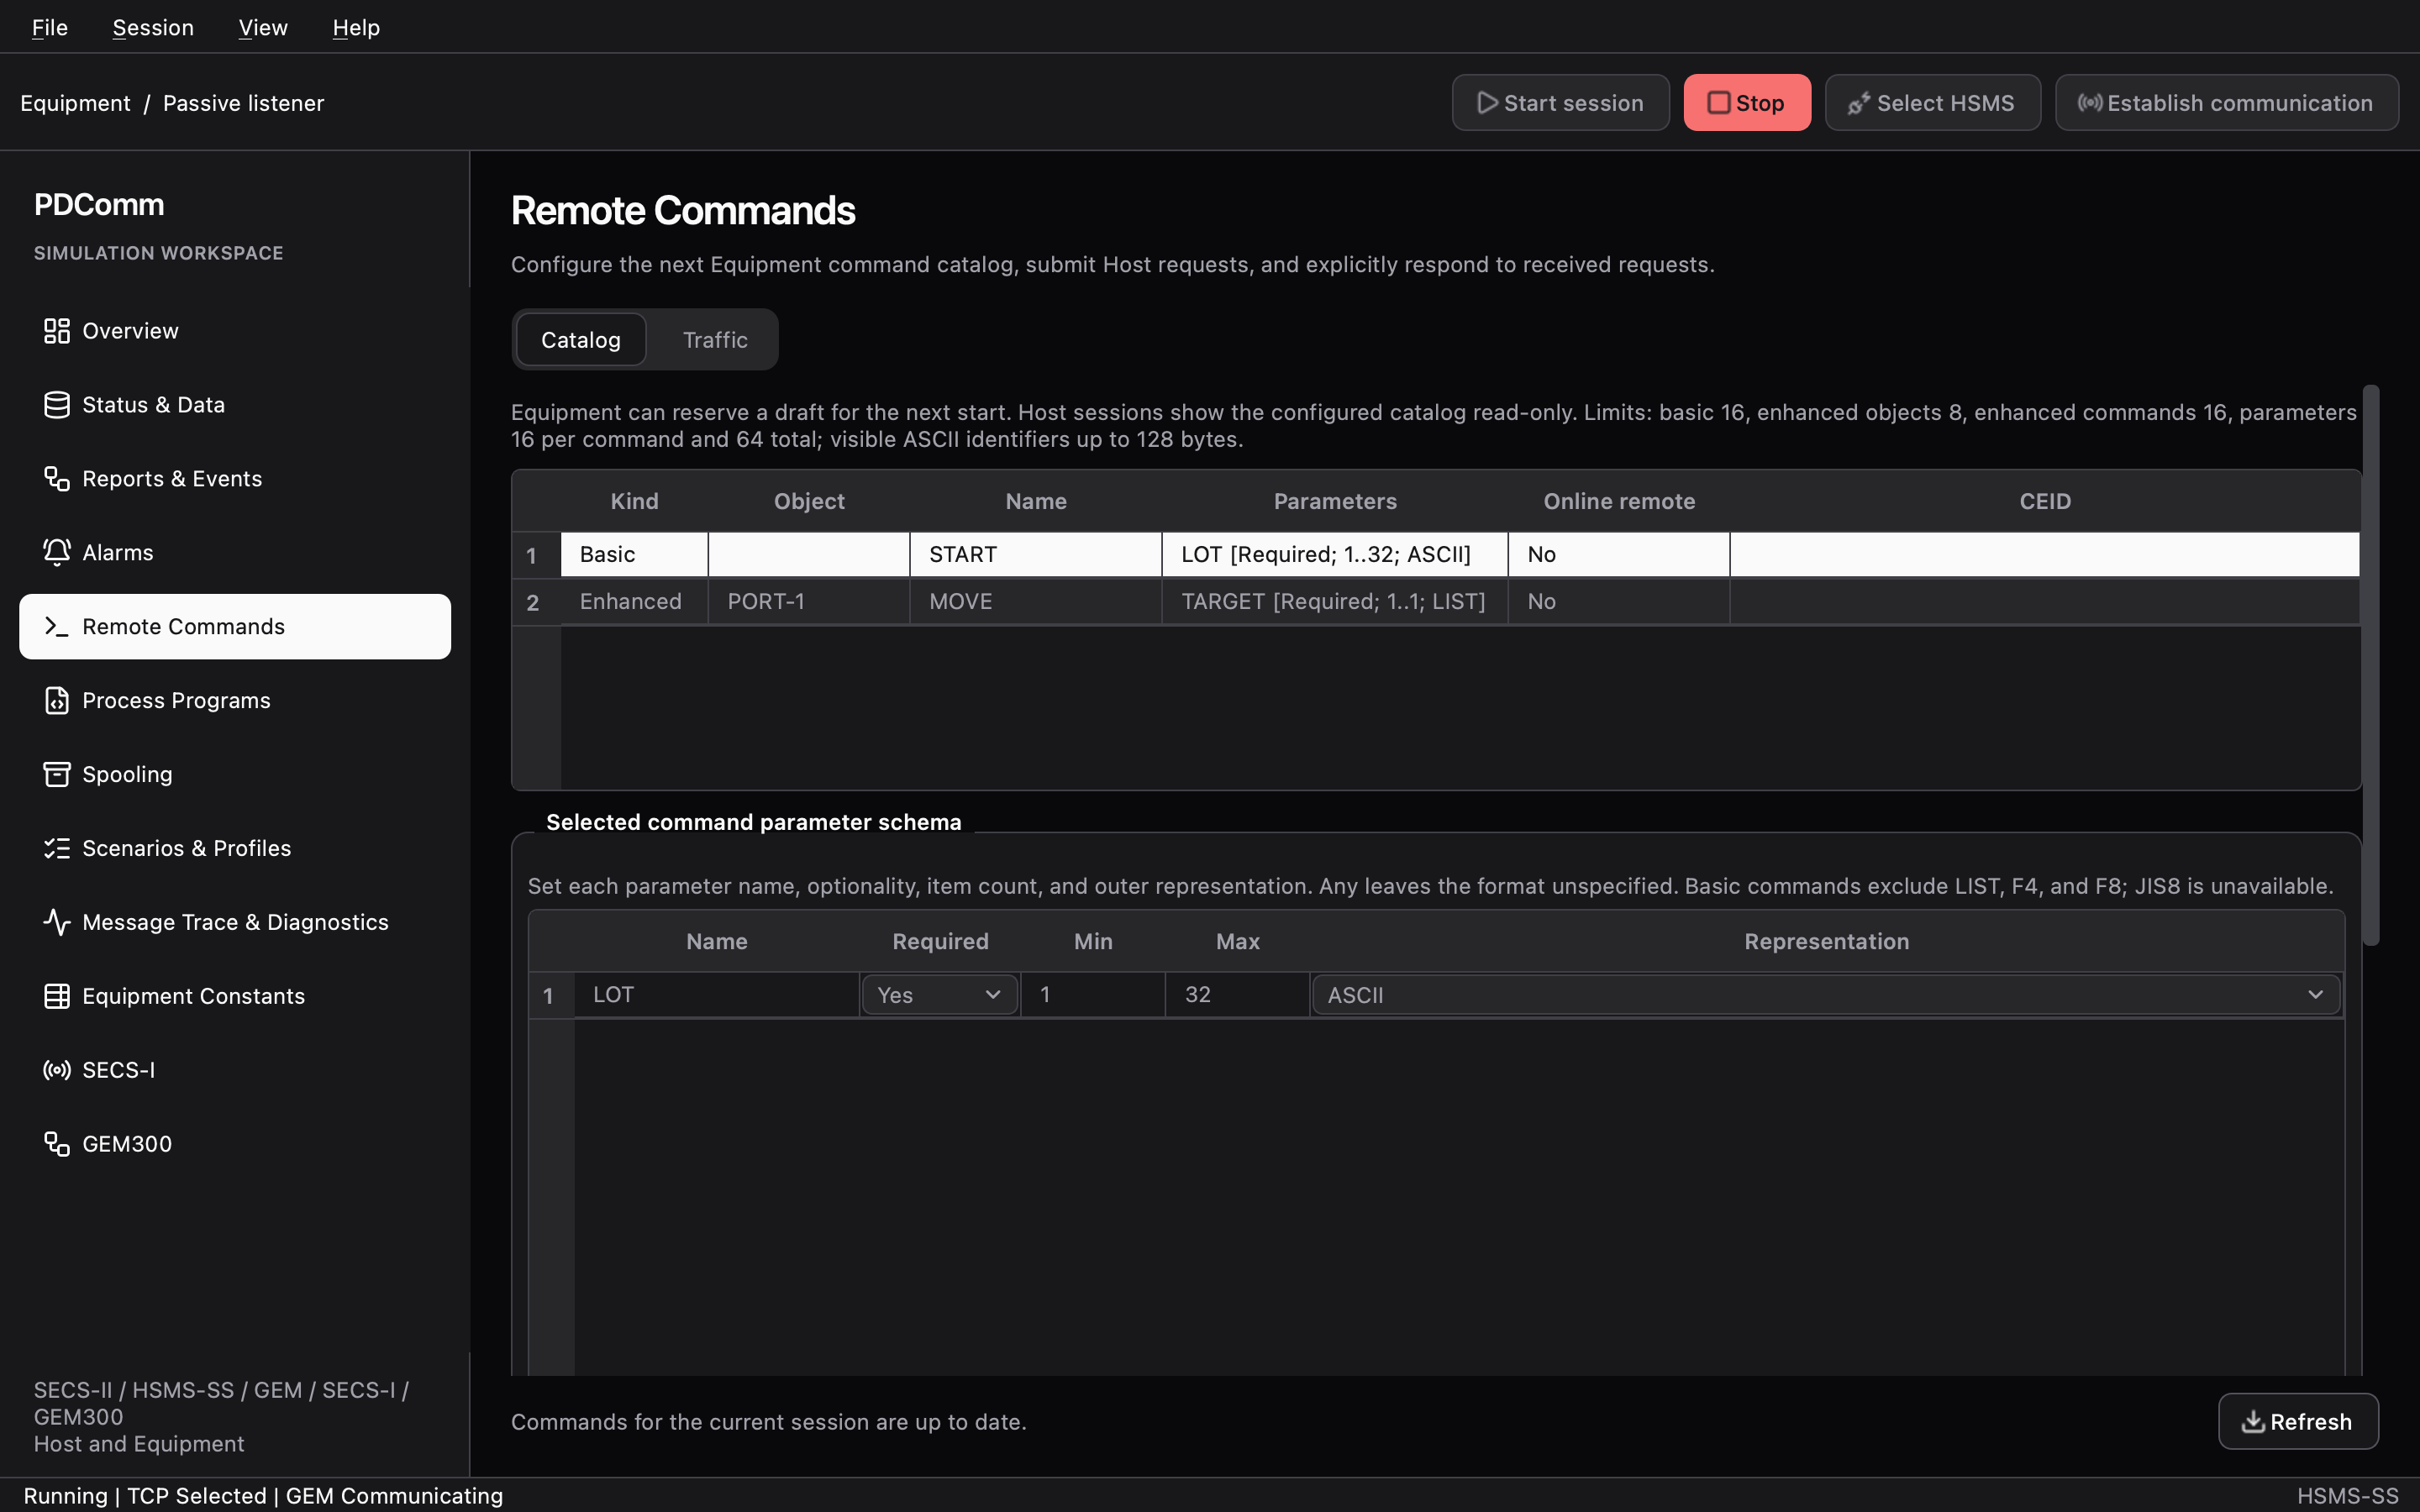
- Catalog (Equipment): define basic (S2F41) and enhanced (S2F49) commands and the parameter schema of each. Load example adds the basic command
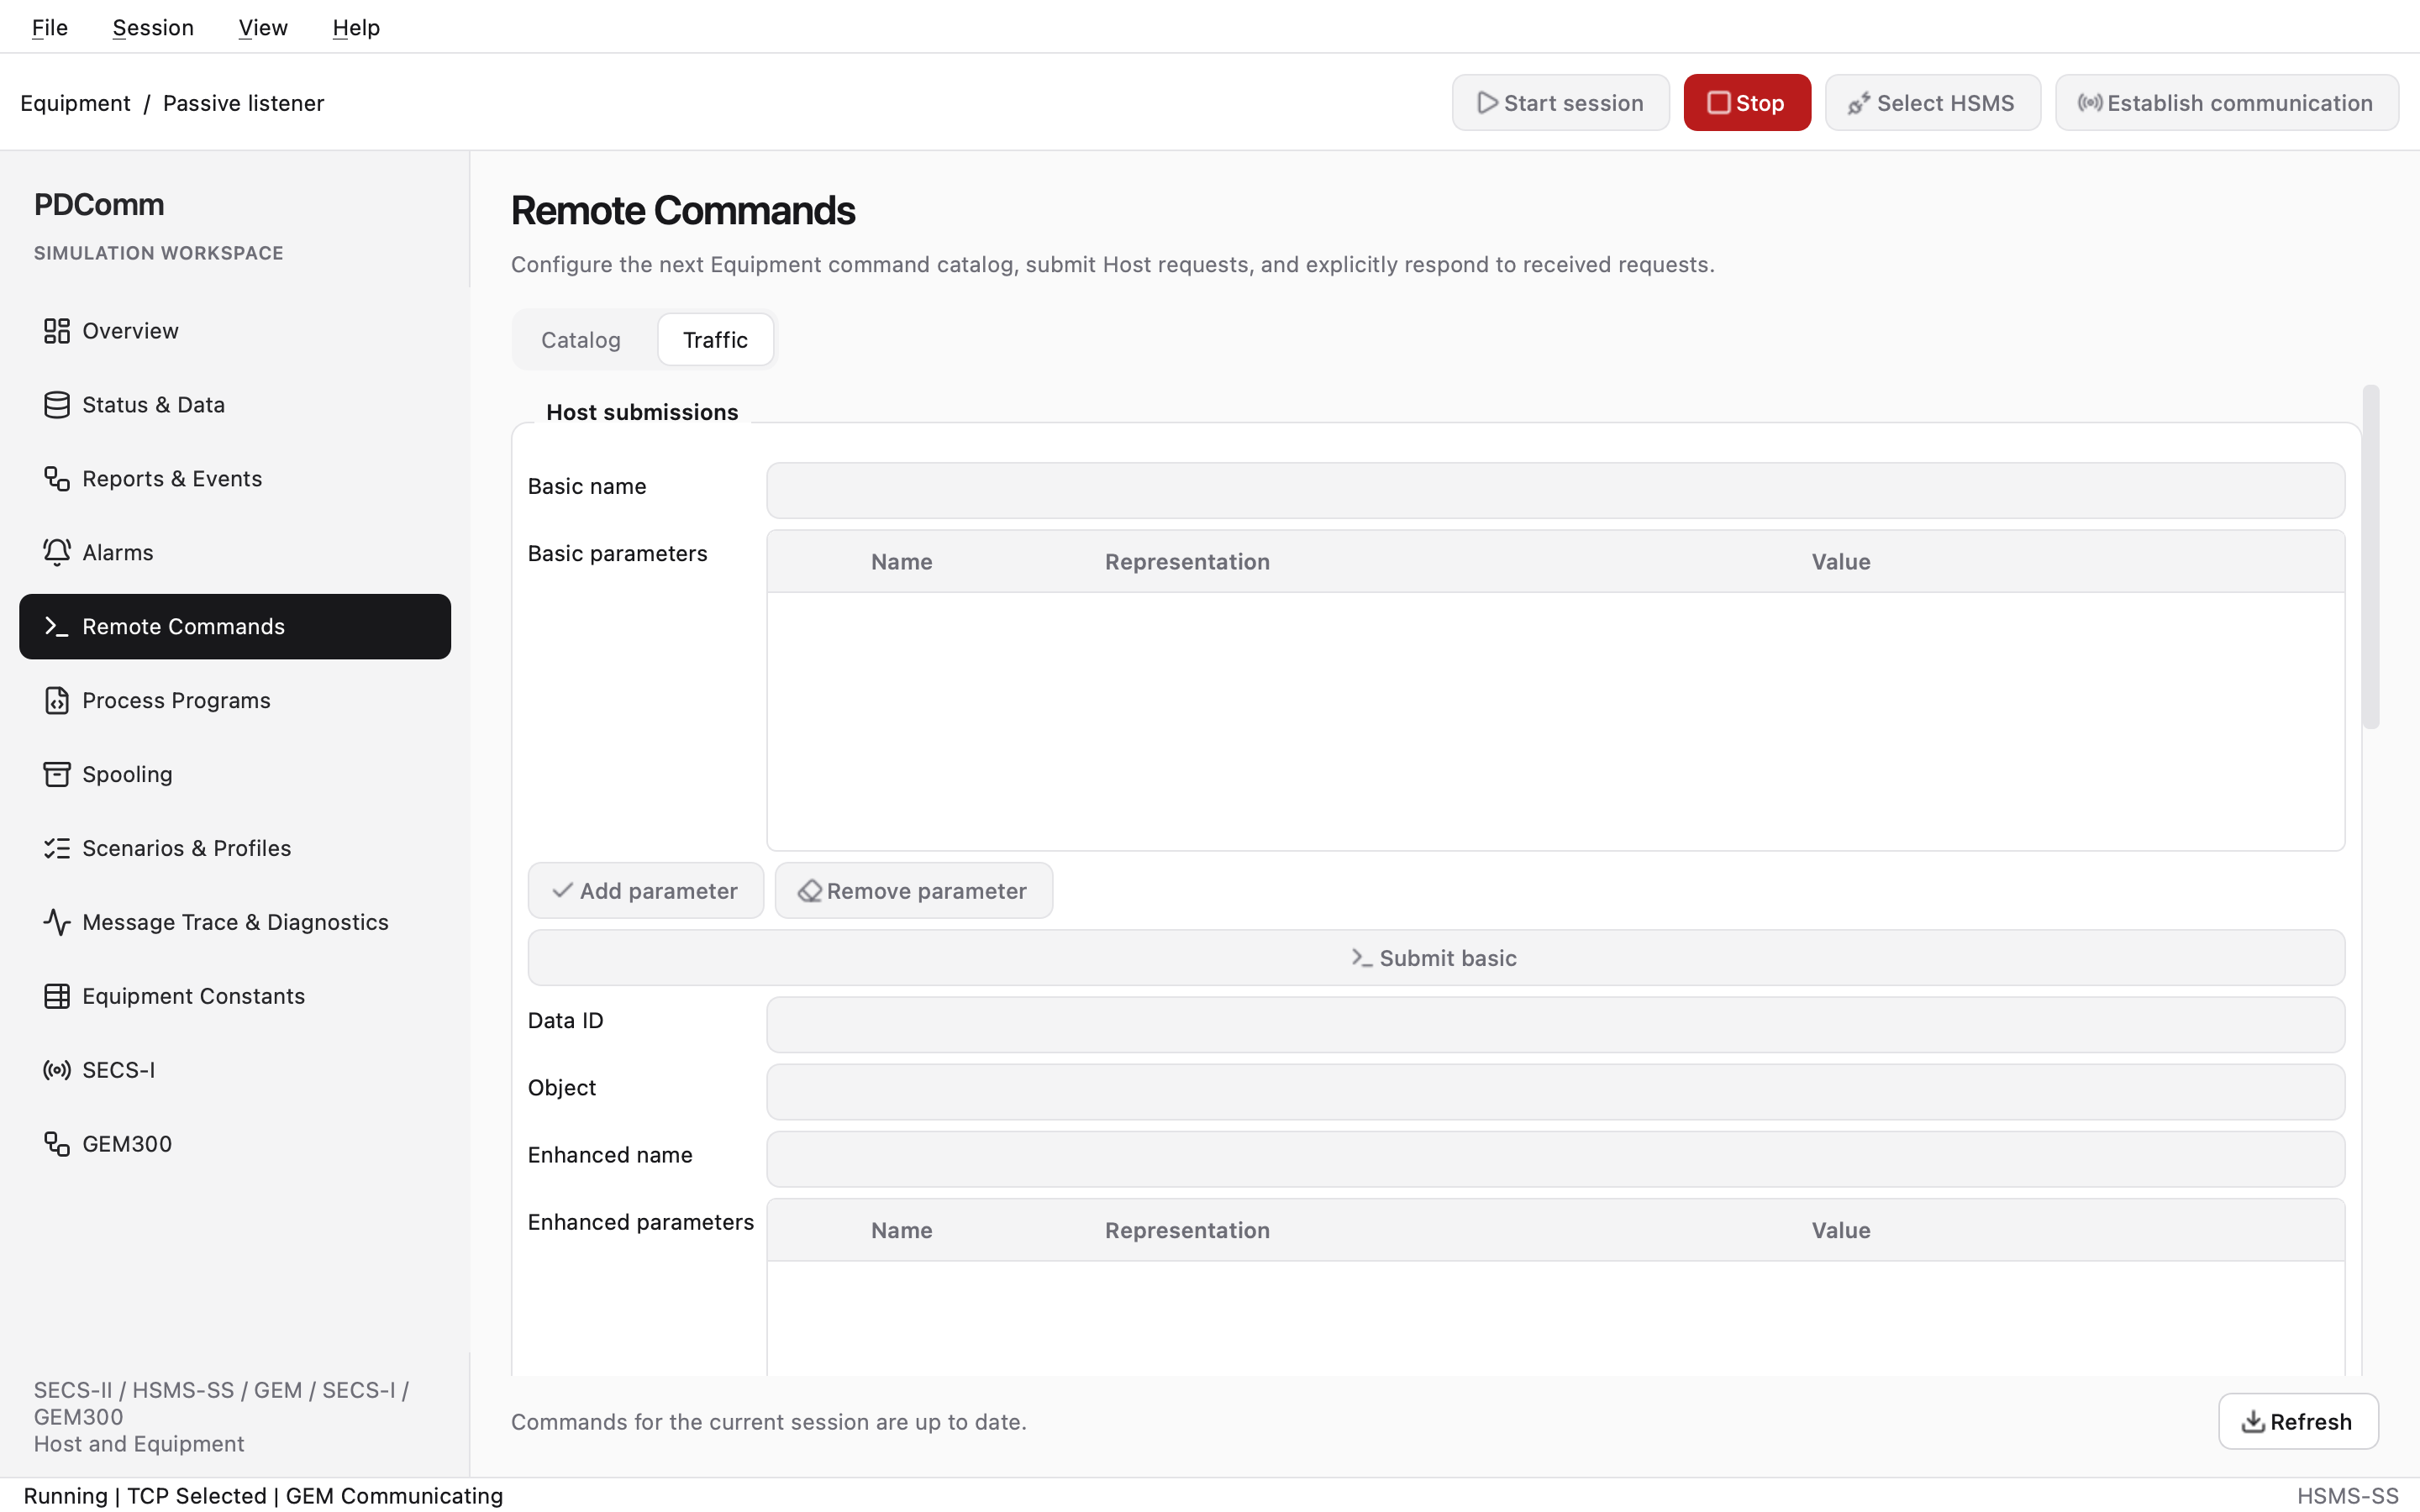
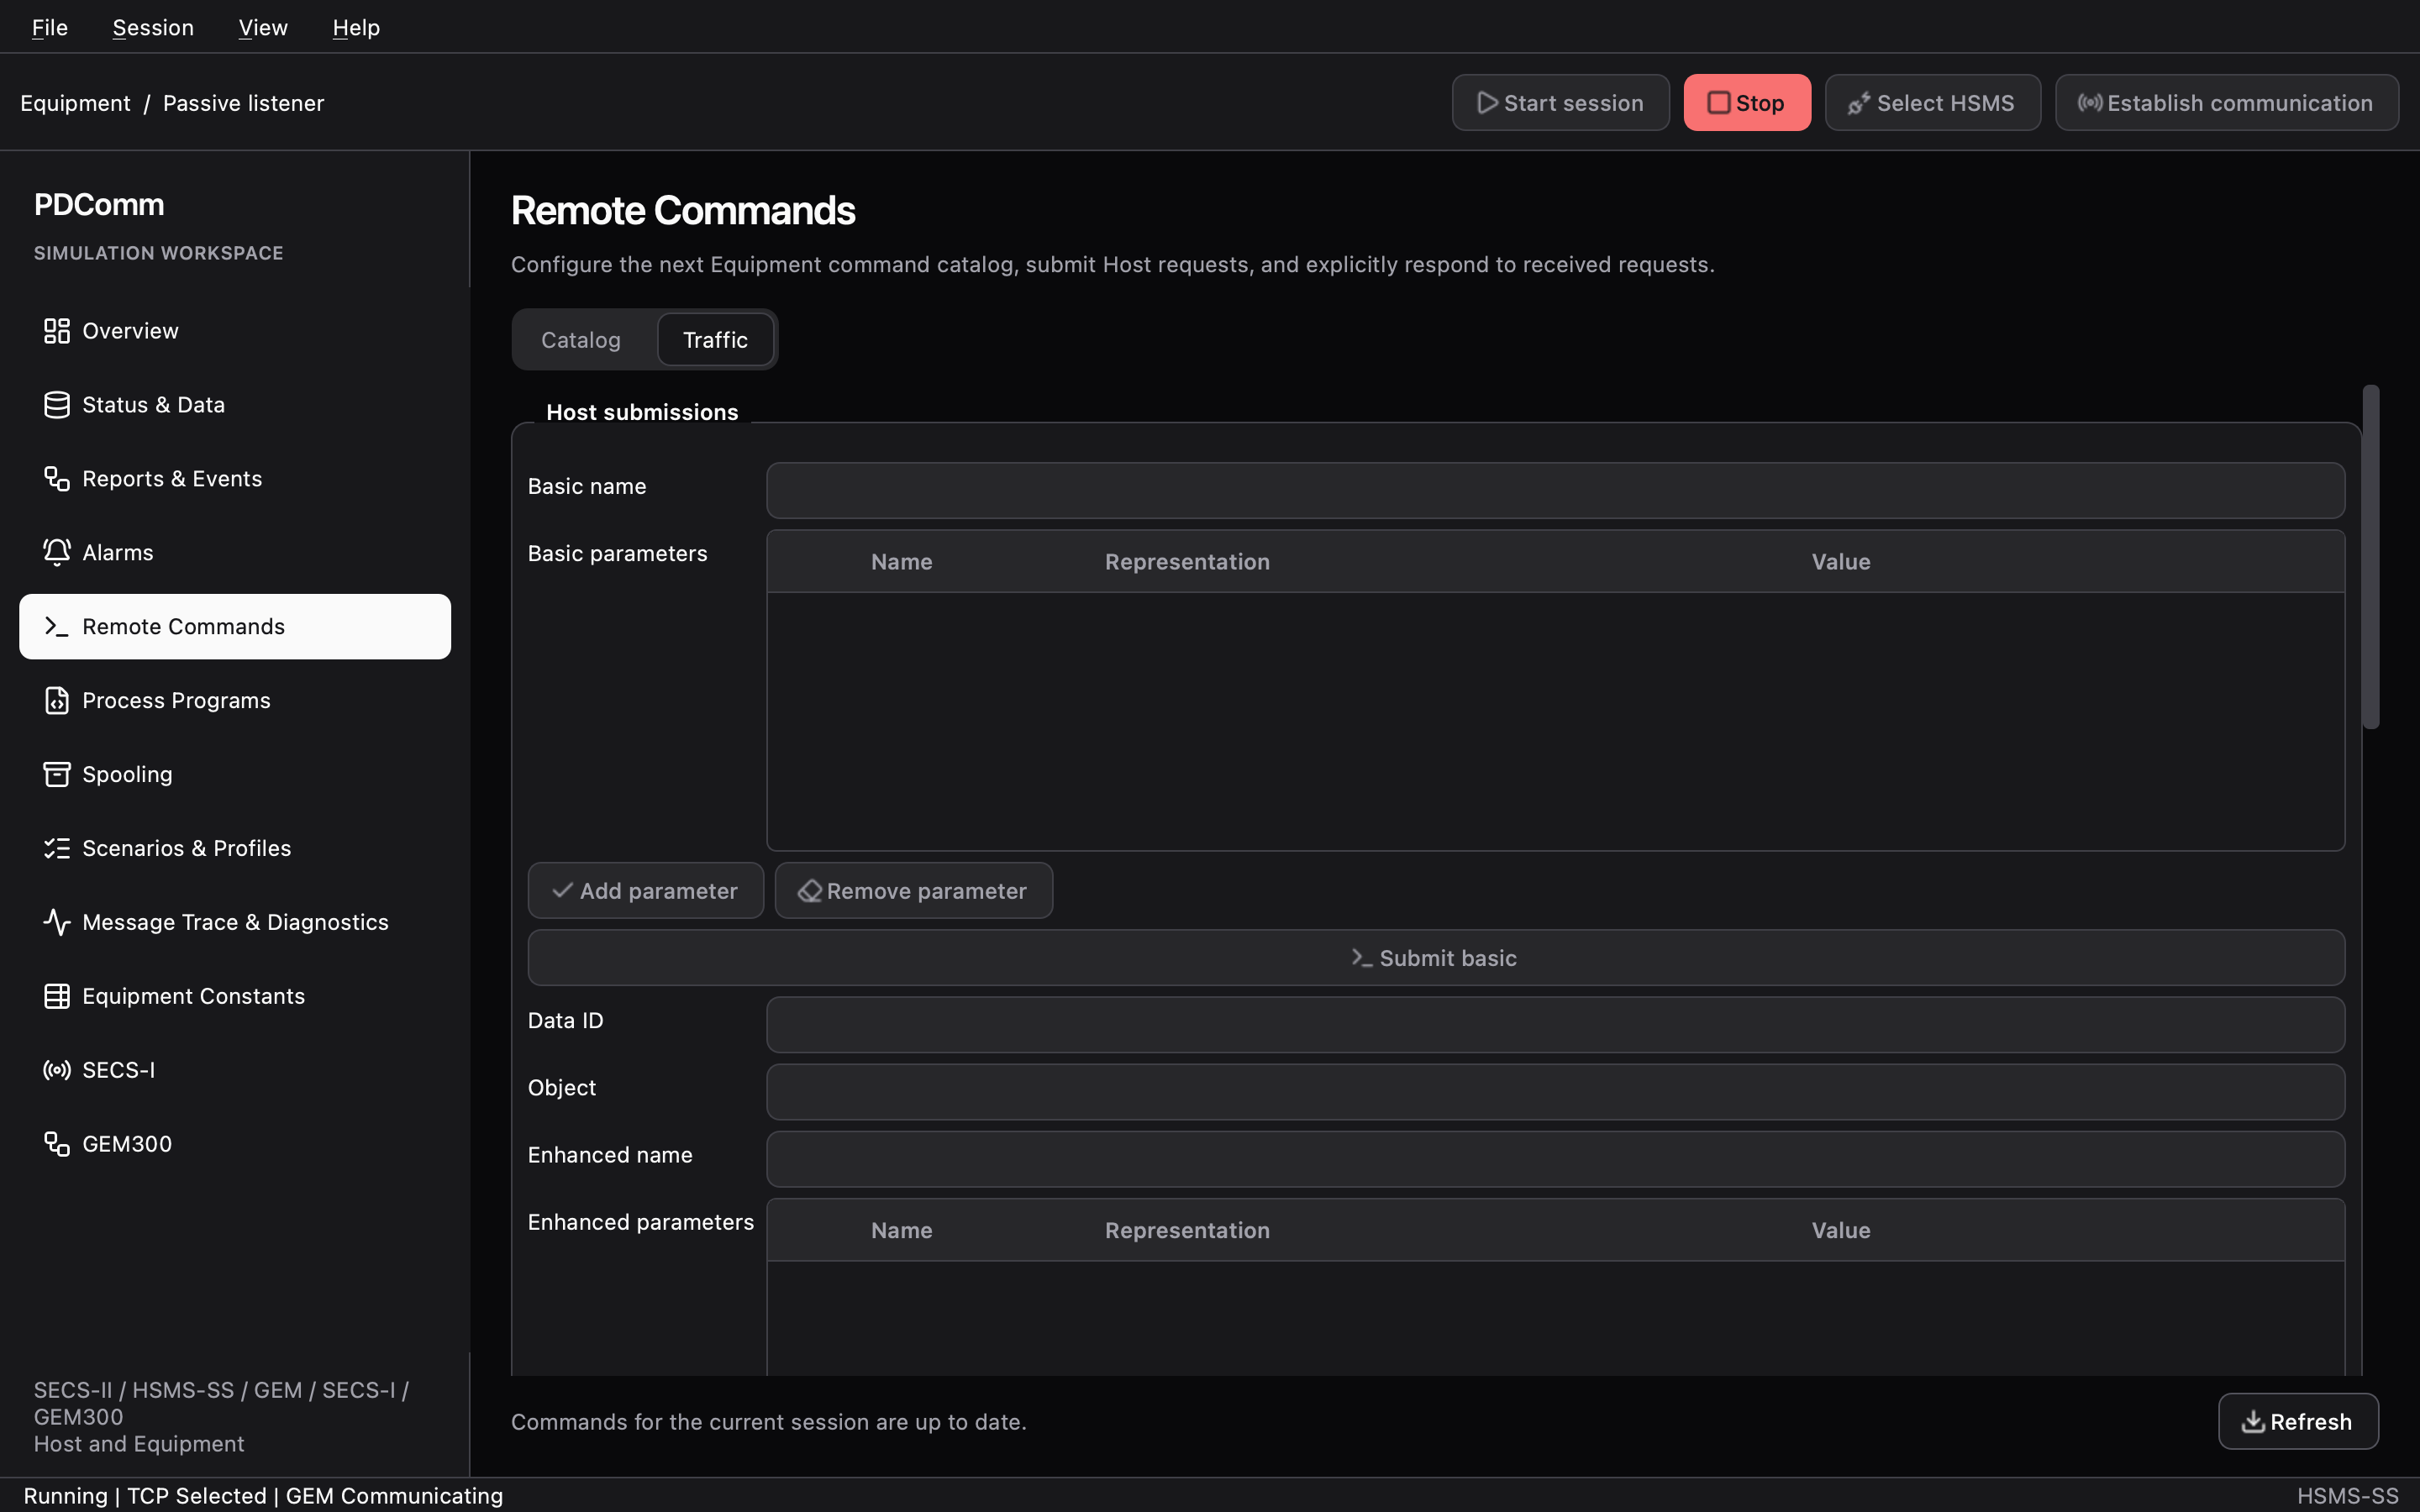
START(parameterLOT, ASCII, 1 to 32 characters) and the enhanced commandMOVEon objectPORT-1(parameterTARGET, LIST). - Traffic: the Host sends commands from Host submissions with Submit basic or Submit enhanced. The Equipment selects a received request, picks one of Decision 0 to Decision 6, and clicks Respond to return the HCACK. The Host selects a result and consumes it with Acknowledge selected result.
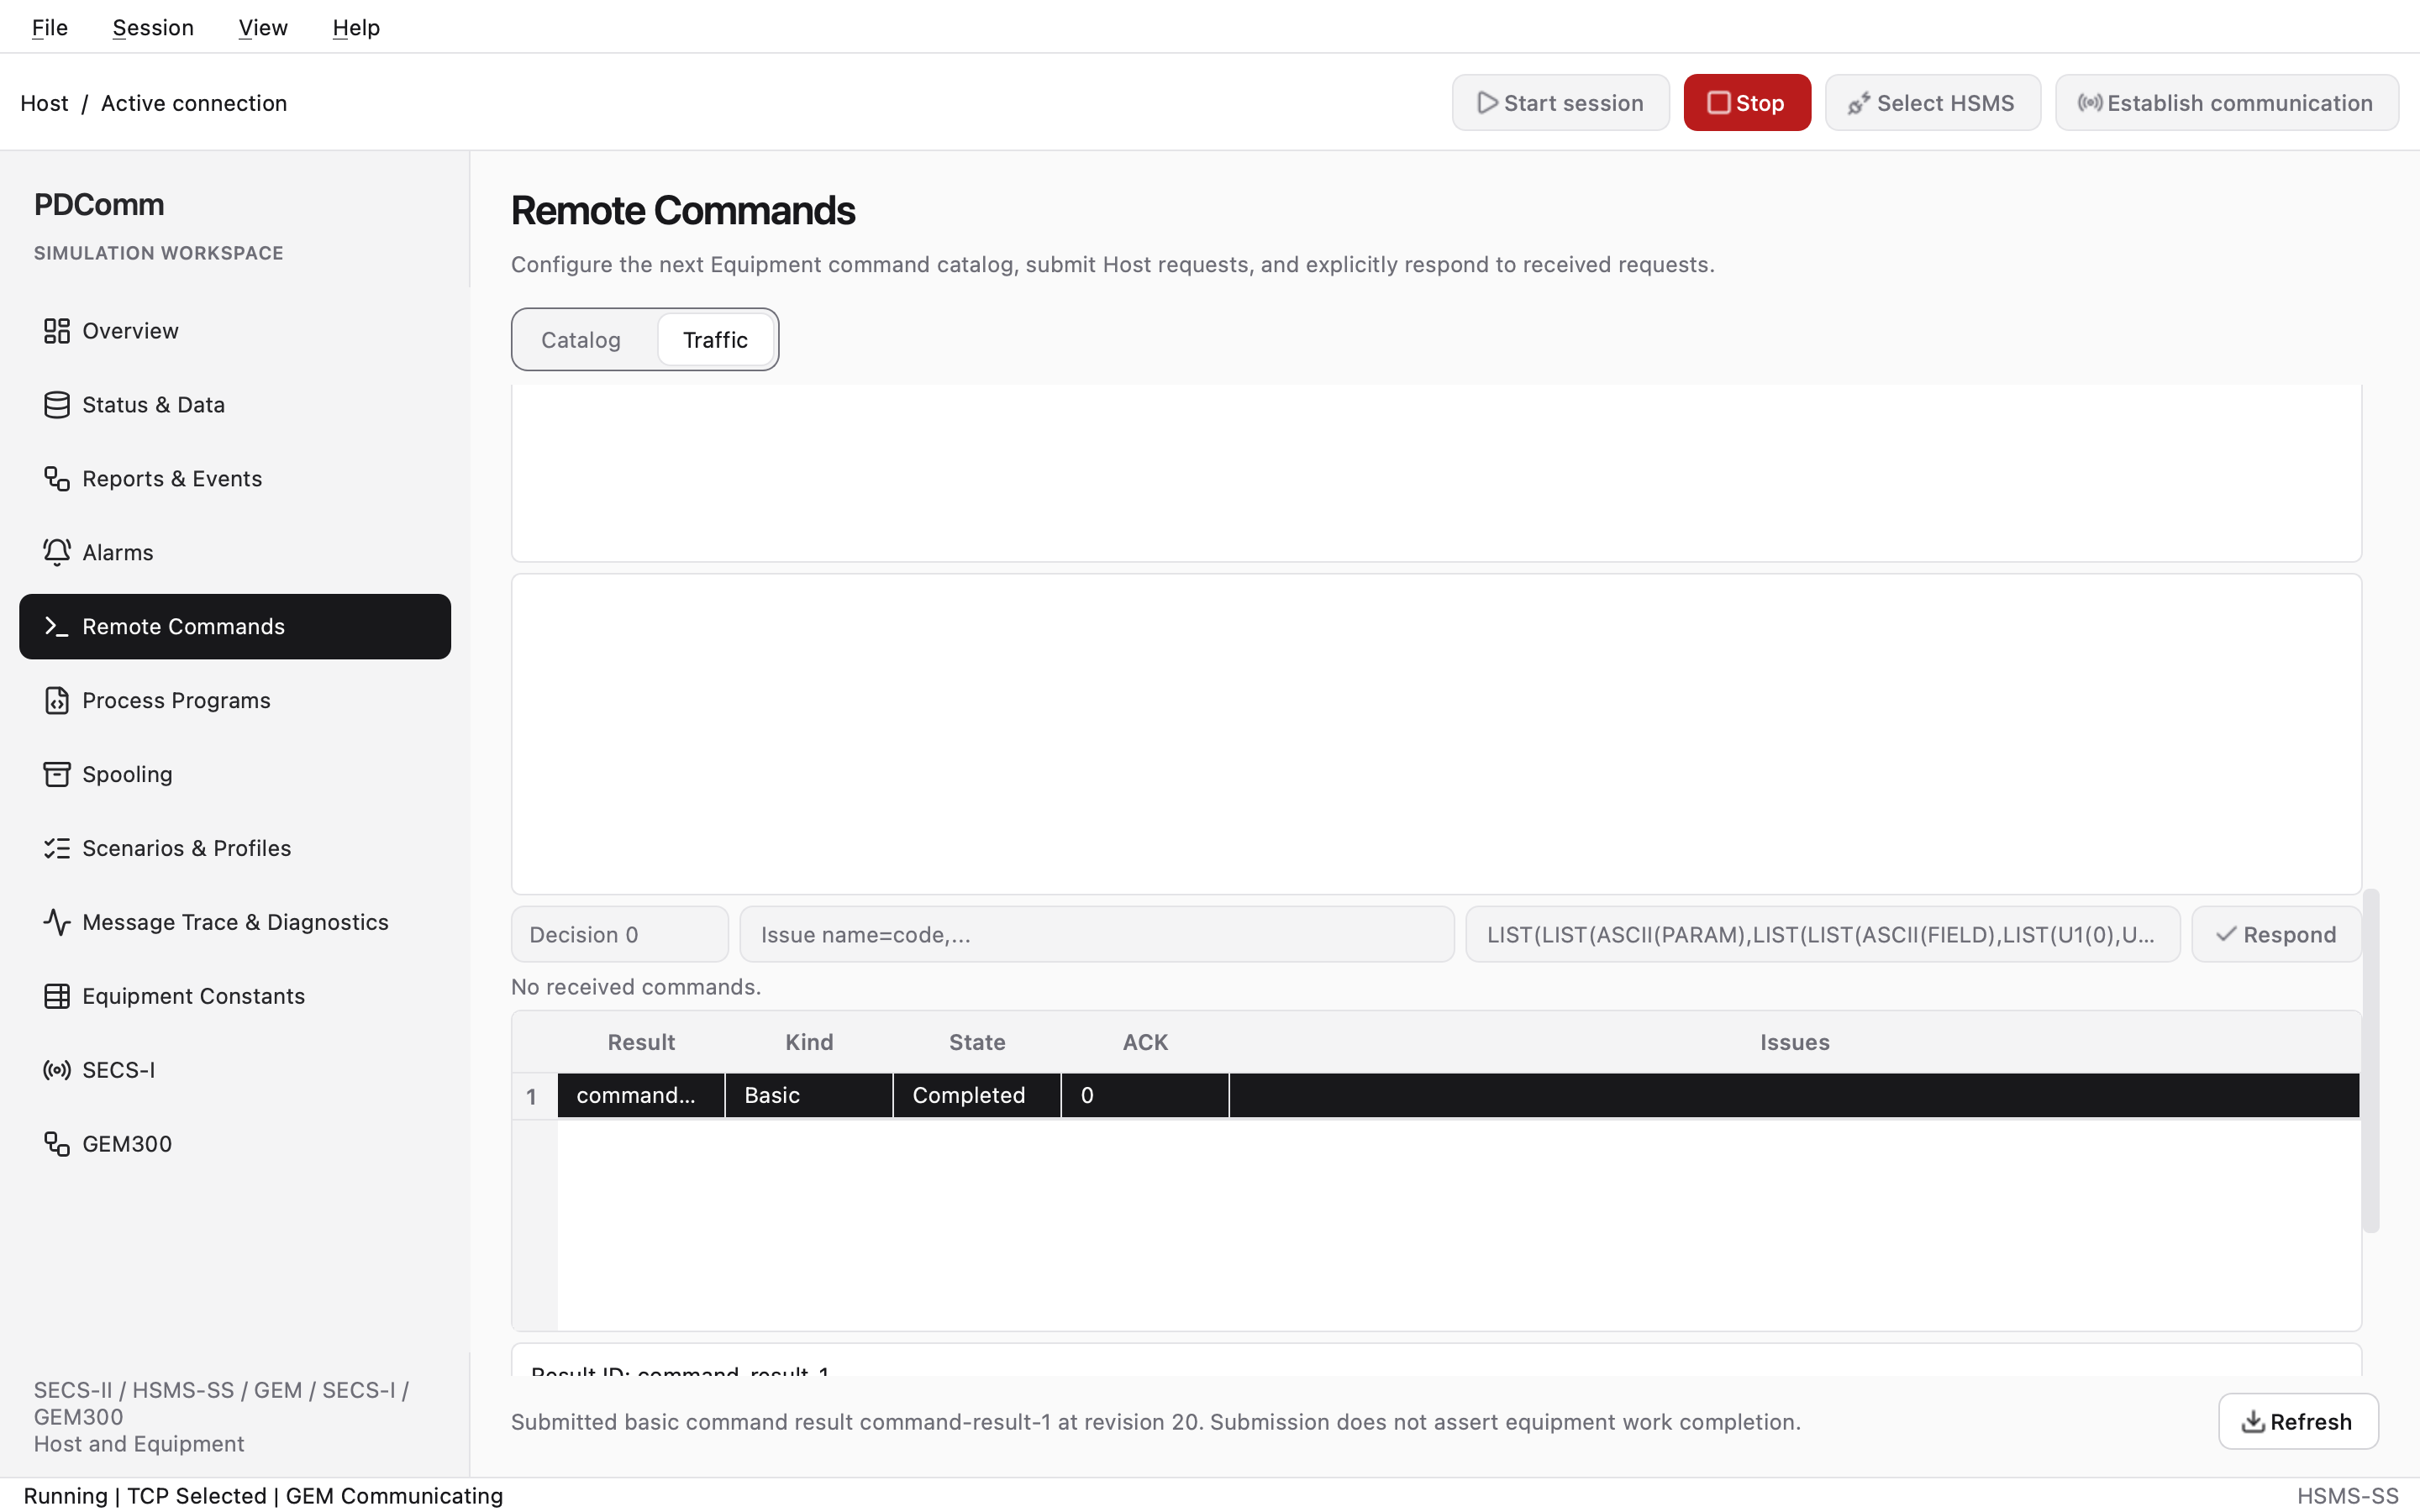
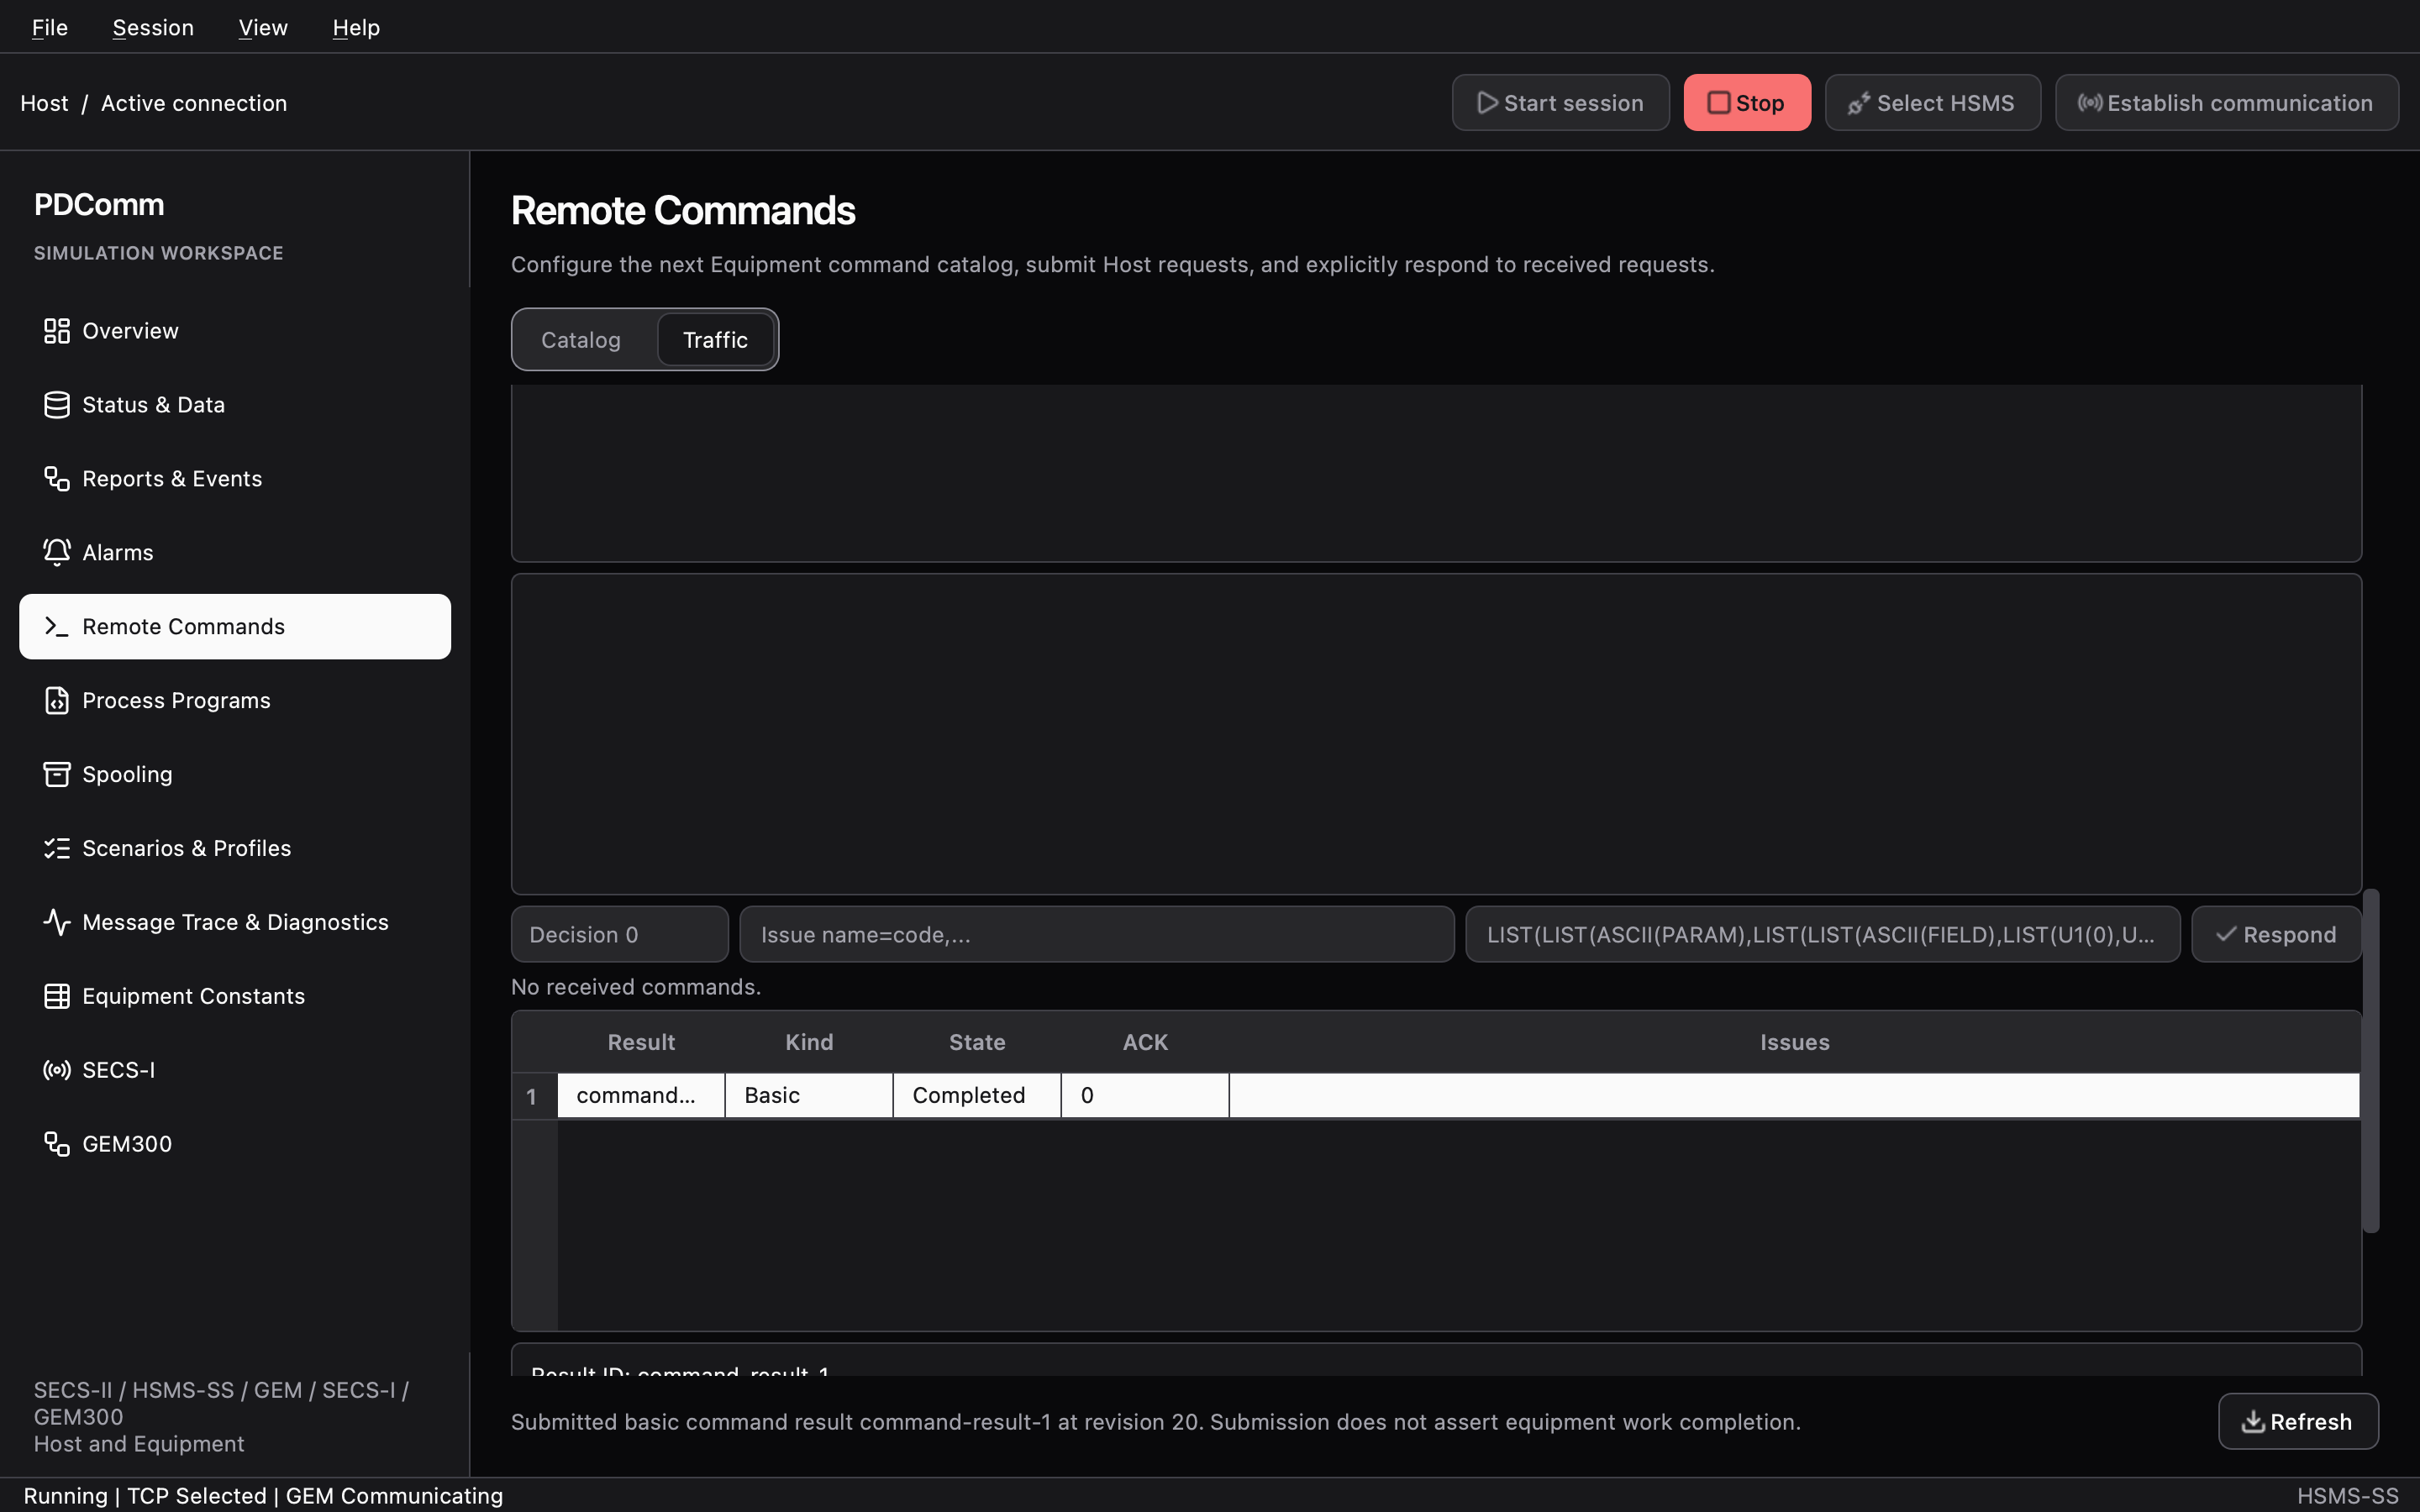
Walkthrough: Remote commands
Process Programs
Section titled “Process Programs”The tabs are Catalog, Traffic, Formatted transfer, Formatted verification, Verification negotiation, Formatted query, Selection, Dry run, Execution, and Capabilities.
- Catalog (Equipment): enter PPIDs and PPBODYs in Equipment program draft. Load example adds
DEMO-PPwith the ASCII bodyDEMO. Grant policy is Optional or Required. Actual session store is the live store; on a retained stopped session you change it locally with Apply selected draft entry, Delete ordered IDs, and Delete all. - Traffic: choose a Kind (Grant, Send, Request, Delete, or Directory) and click Submit to run an unformatted process program transaction (S7F1–S7F6, S7F17, S7F19). Only the Host sends Delete and Directory. Answer a received request by picking a decision code and a store mode (Create, Replace, or Upsert) and clicking Respond. The lower part of the tab handles S7F27 verification reports (Submit S7F27) and the S7F28 response.
- Formatted program tabs: Formatted transfer (S7F23/F24), Formatted verification (S7F31/F32), Verification negotiation (S7F29/F30), Formatted query (S7F25/F26), and Capabilities (S7F21/F22) cover formatted program transactions. Selection, Dry run, and Execution are local Equipment features: they exercise selection, structural analysis, and the execution handshake without moving any equipment.
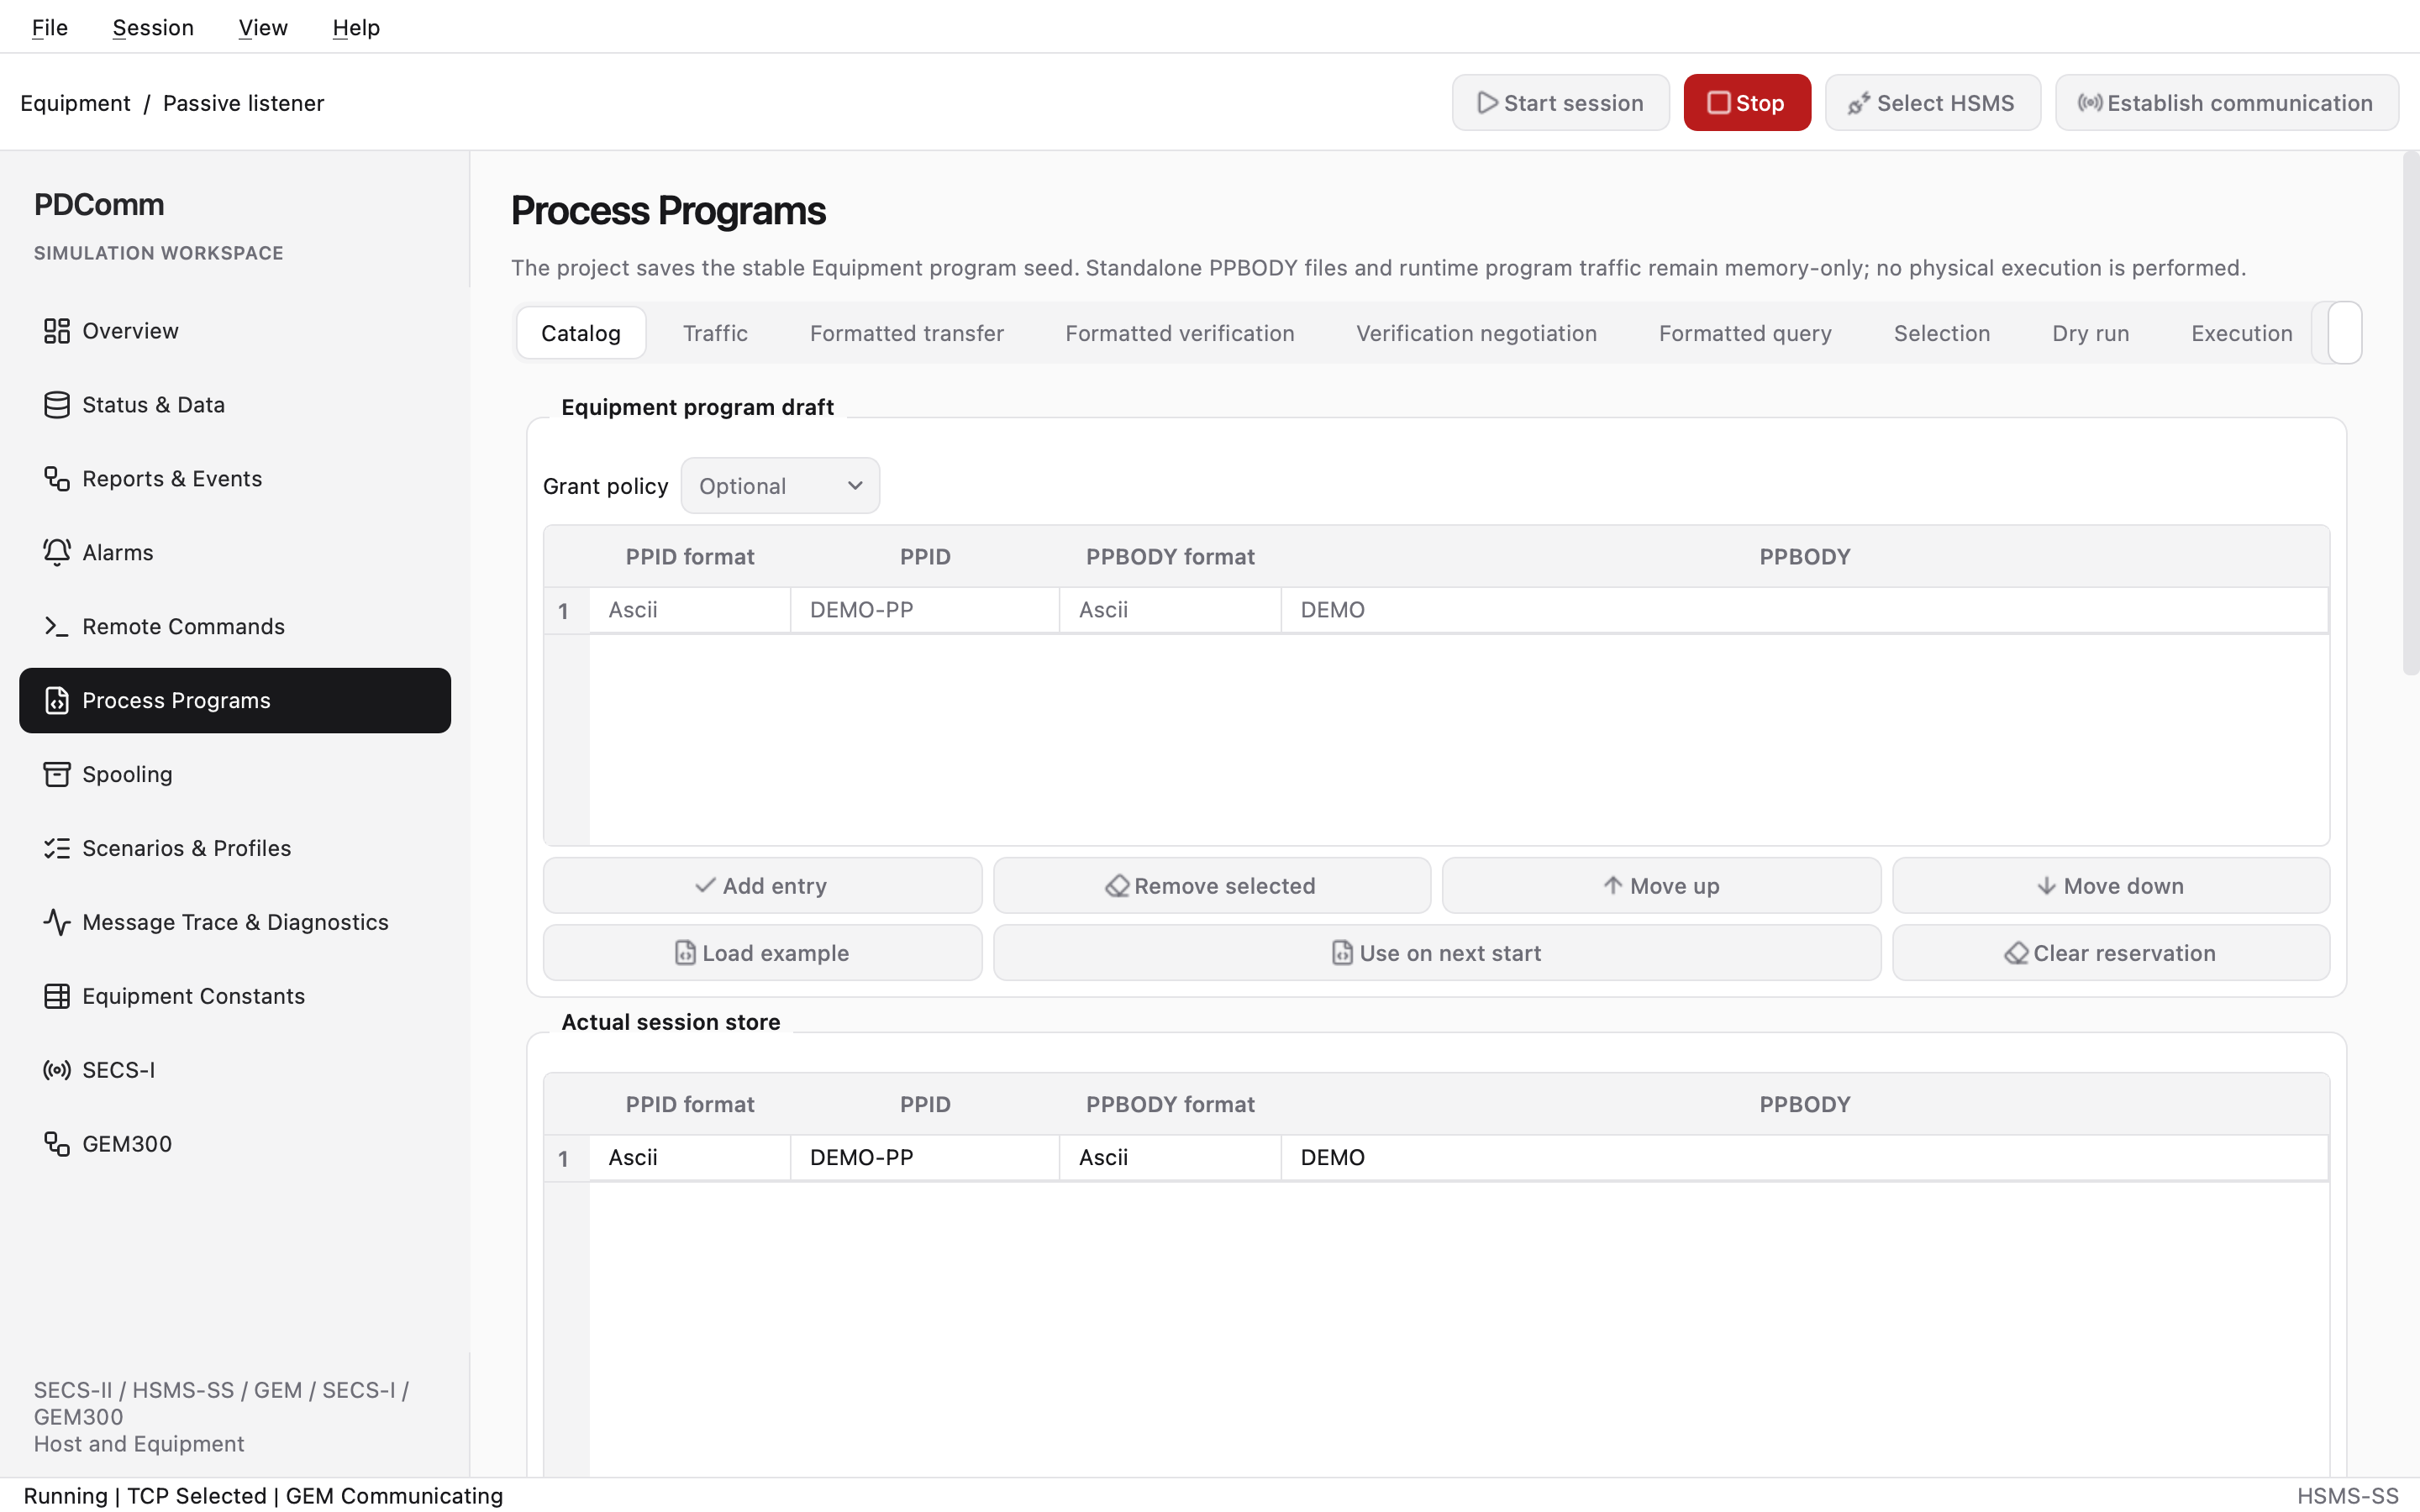
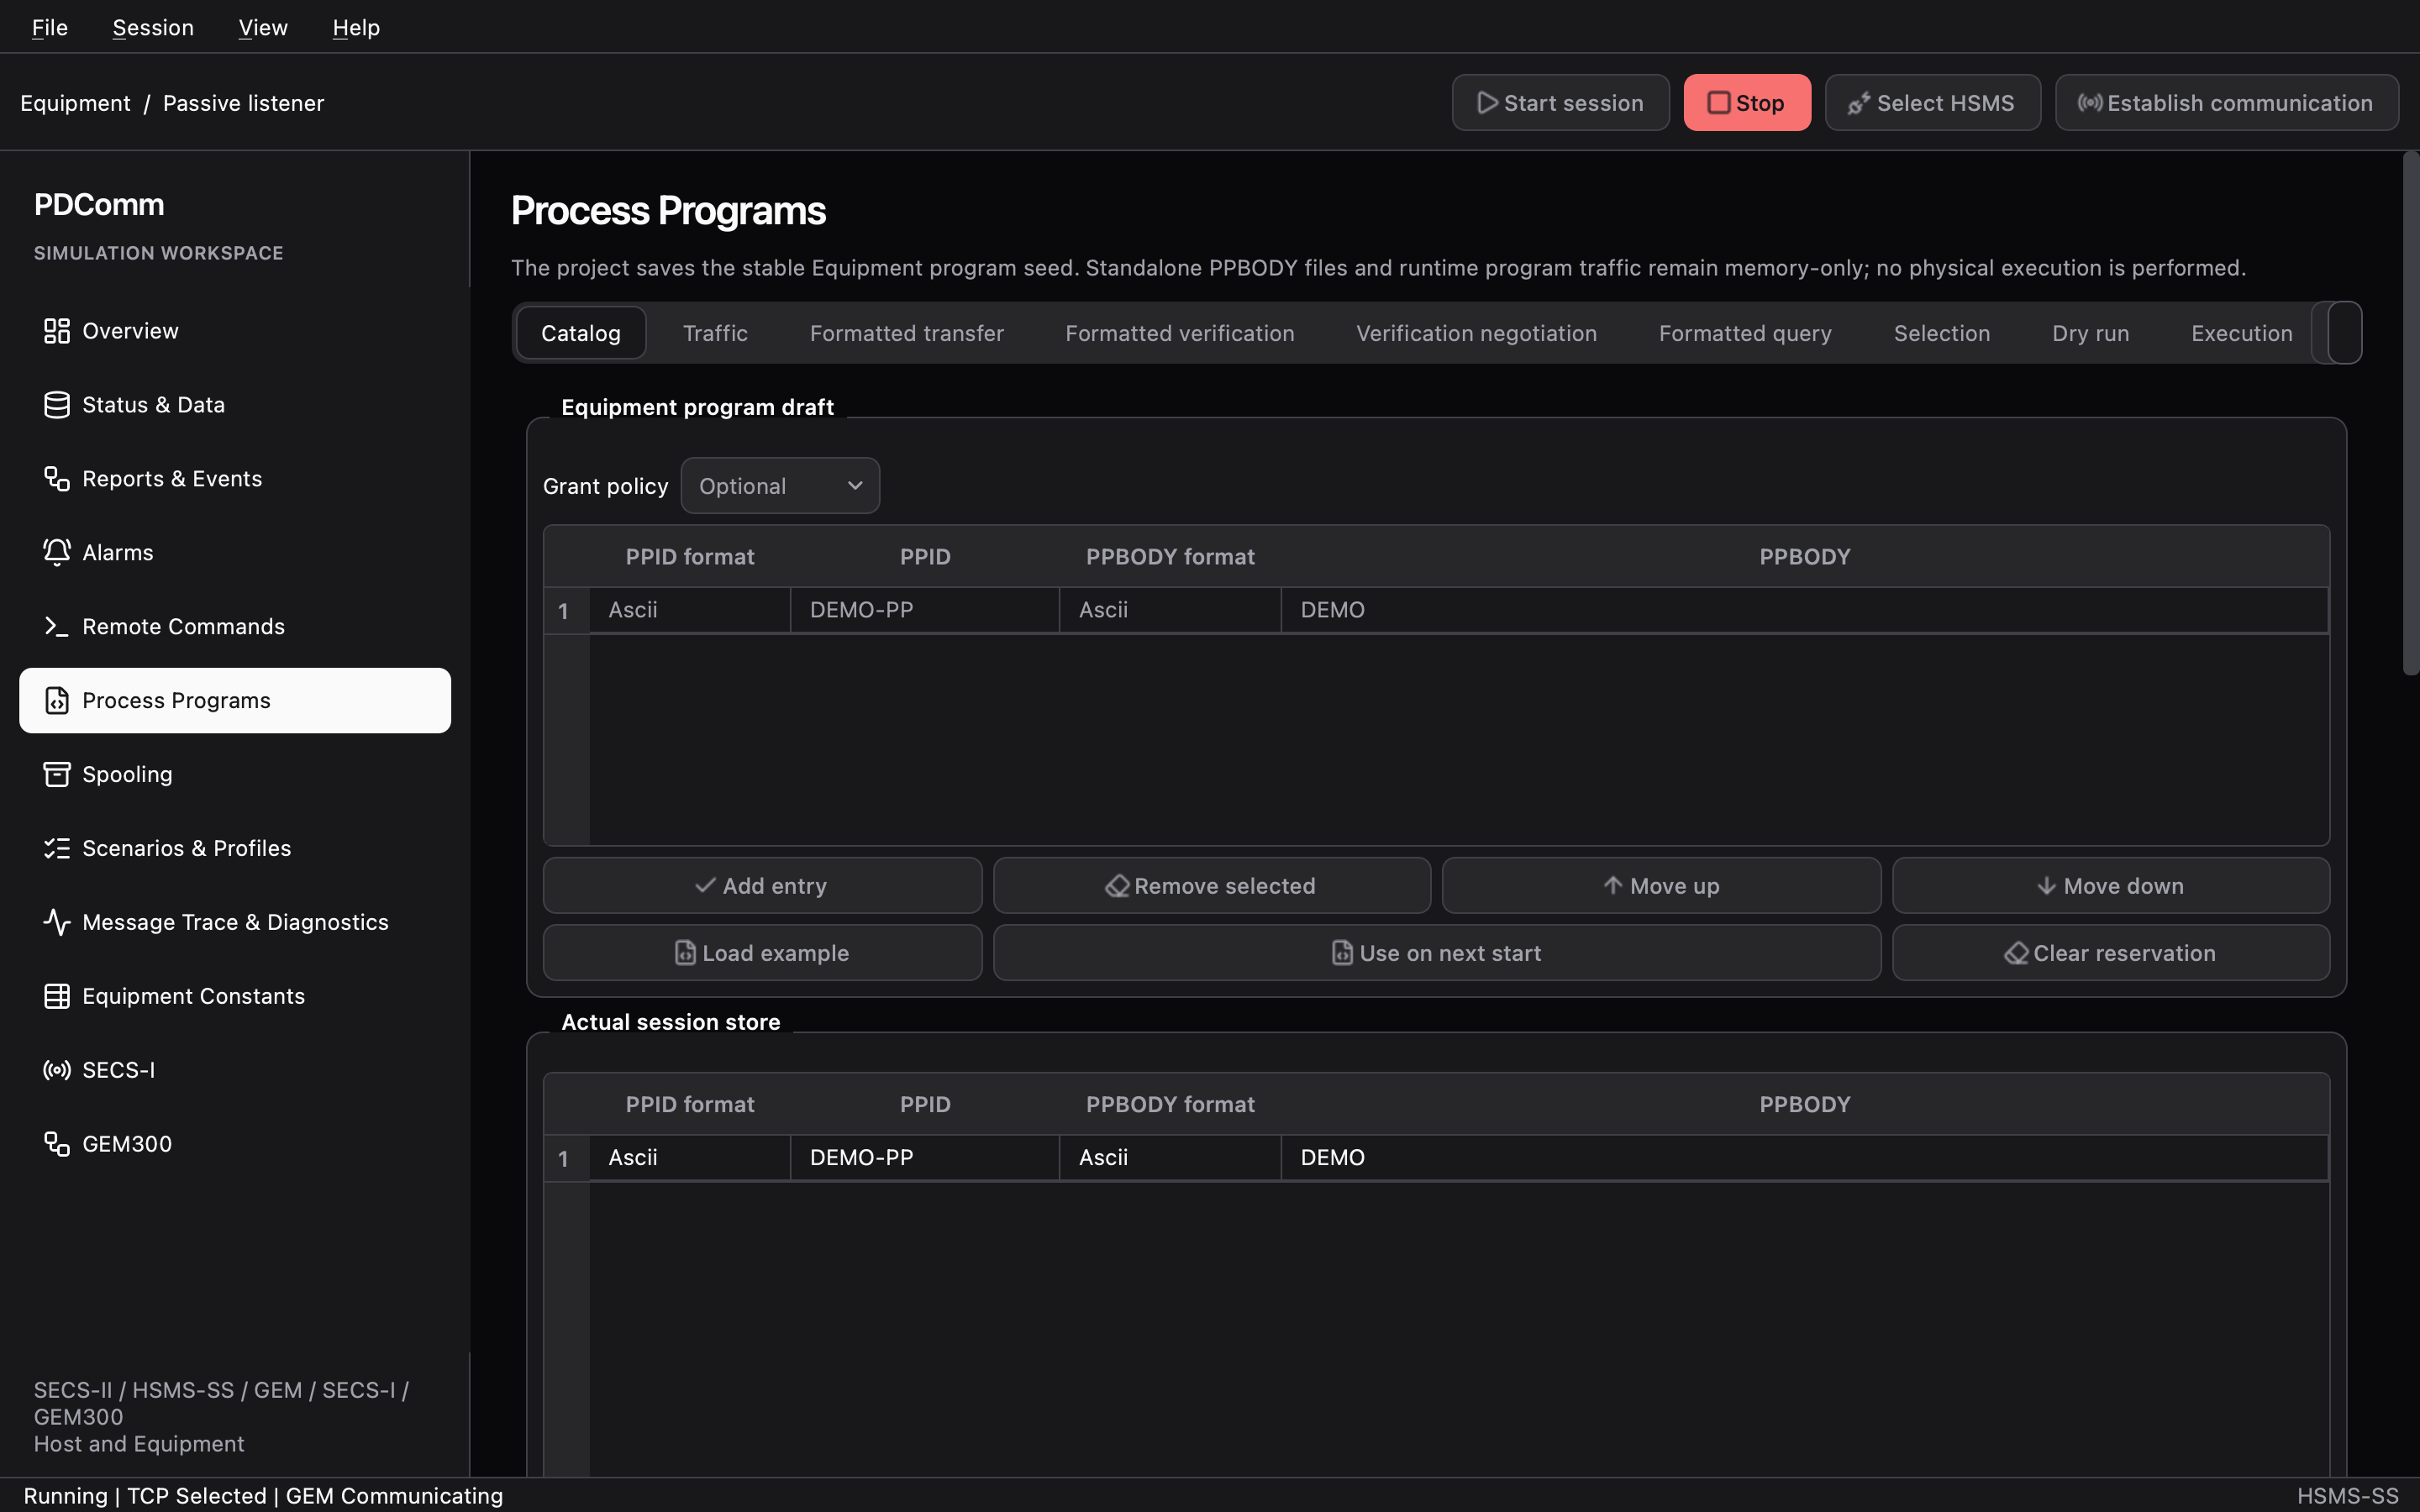
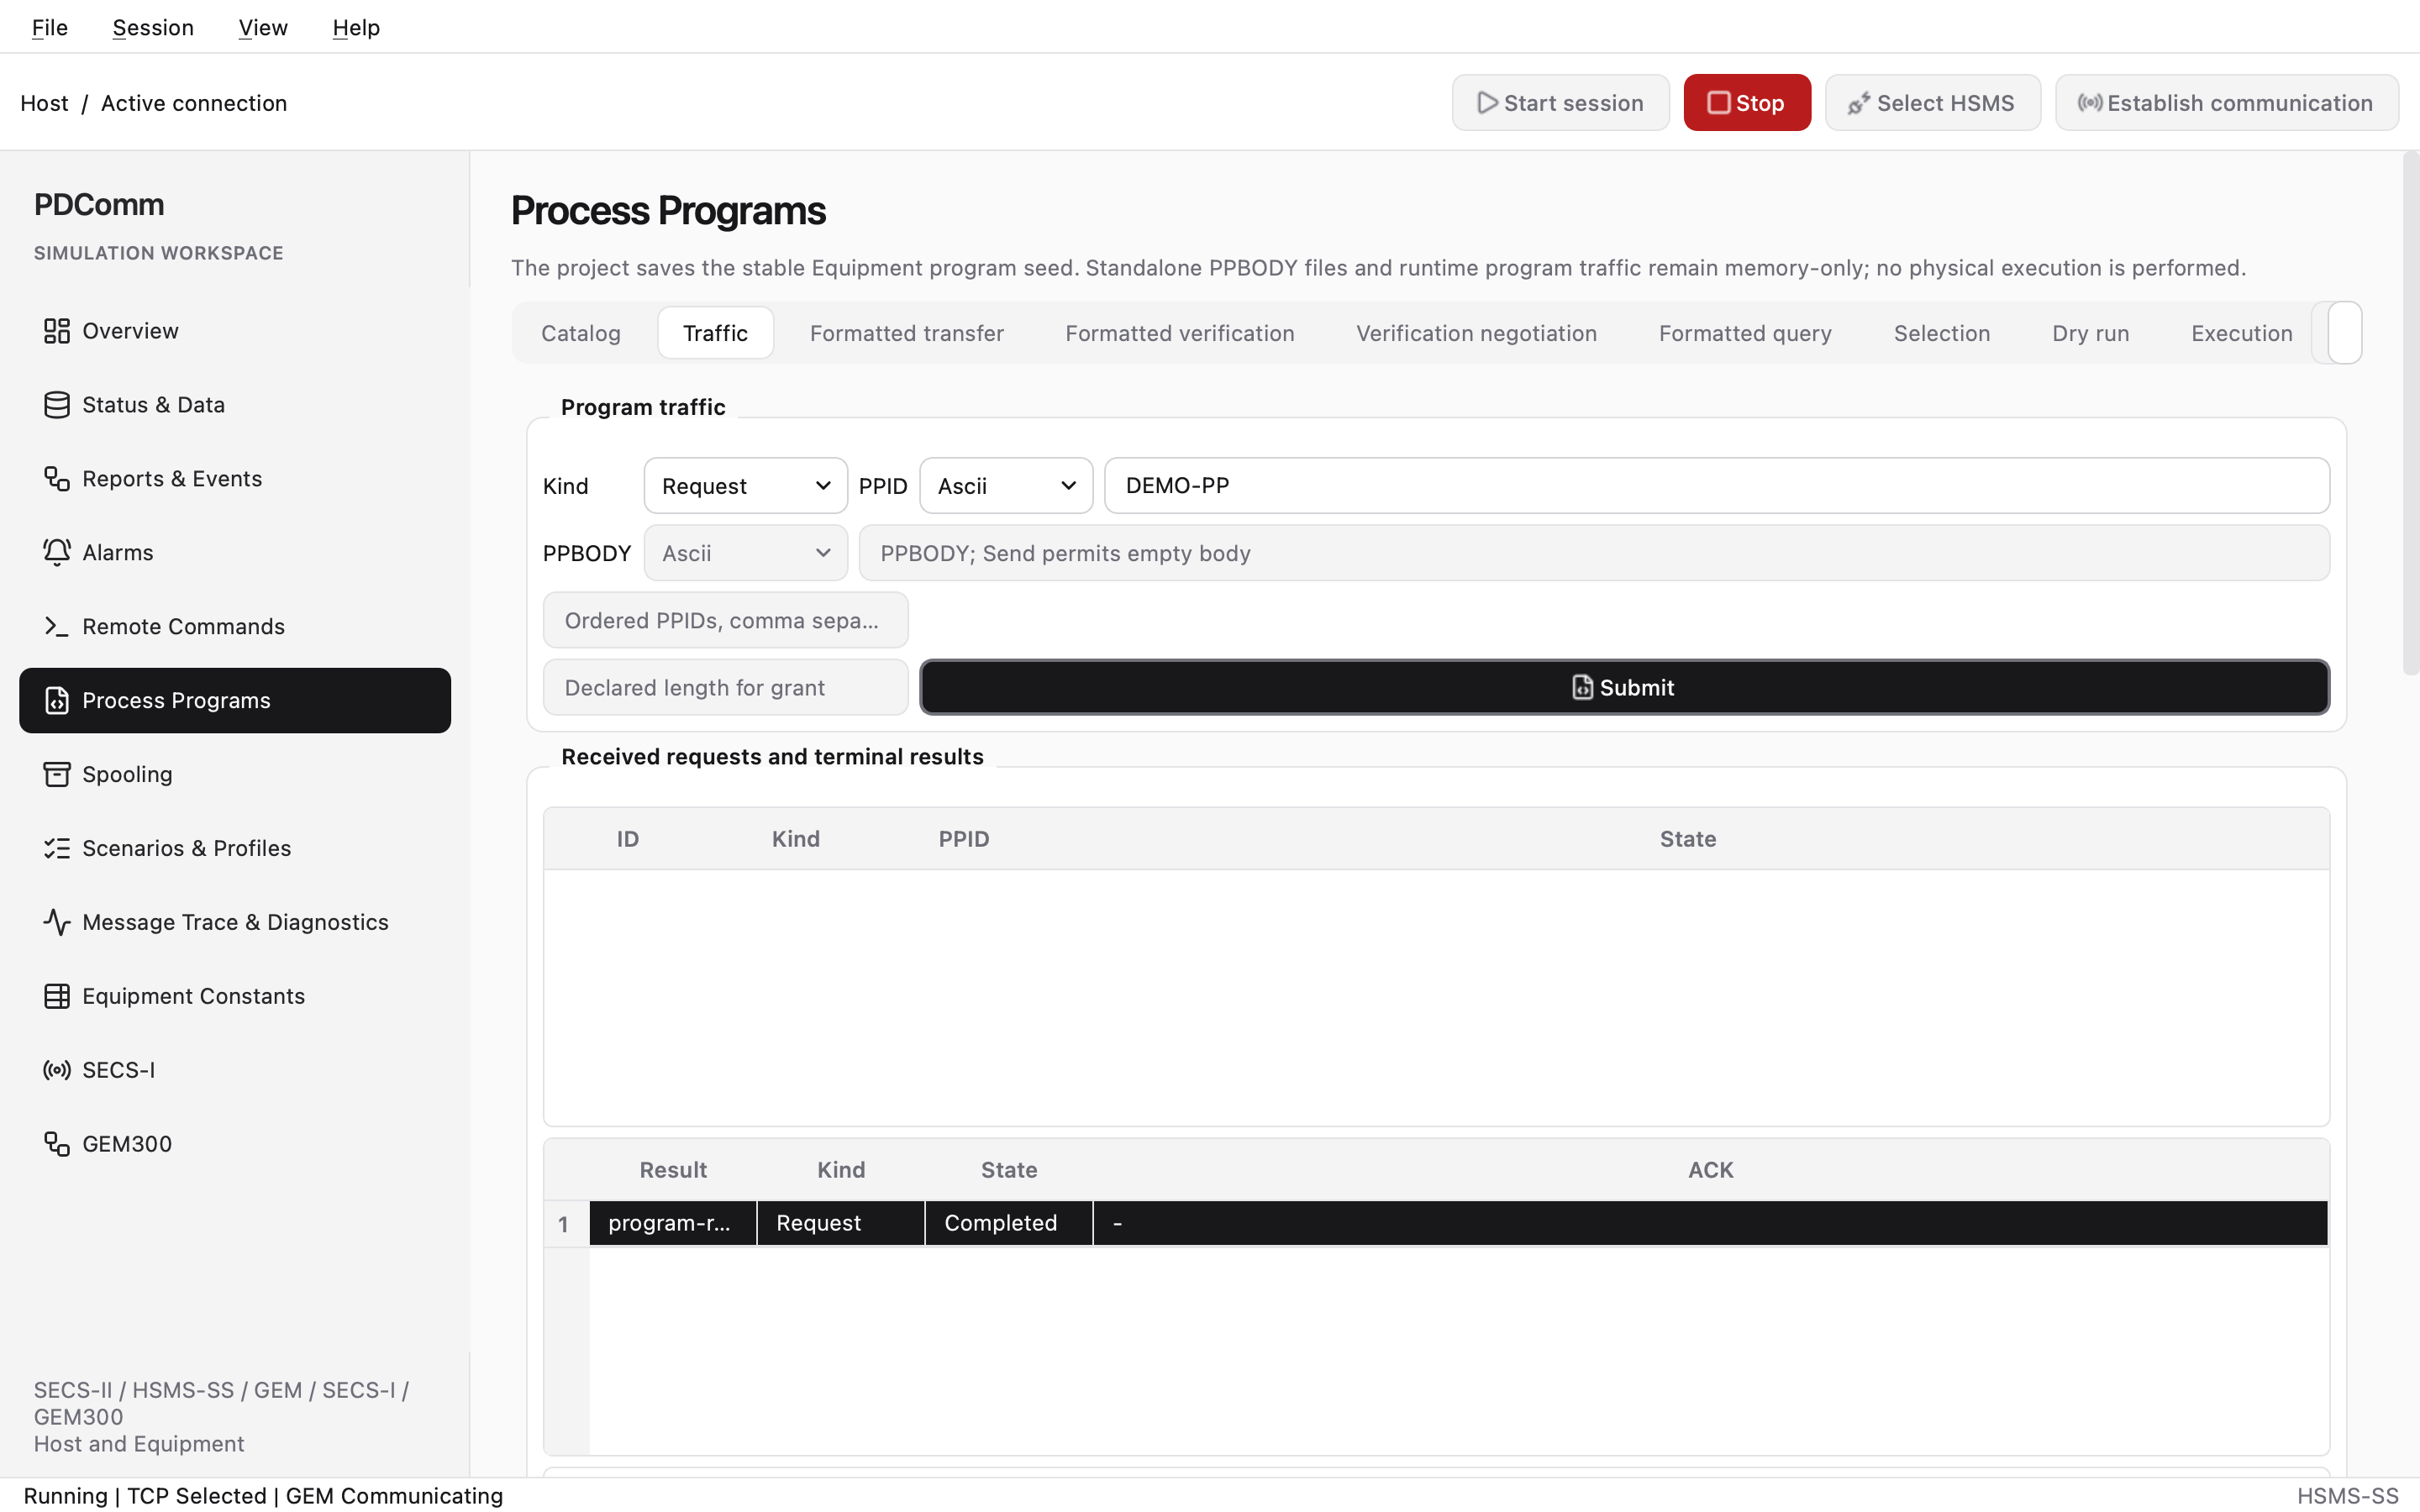
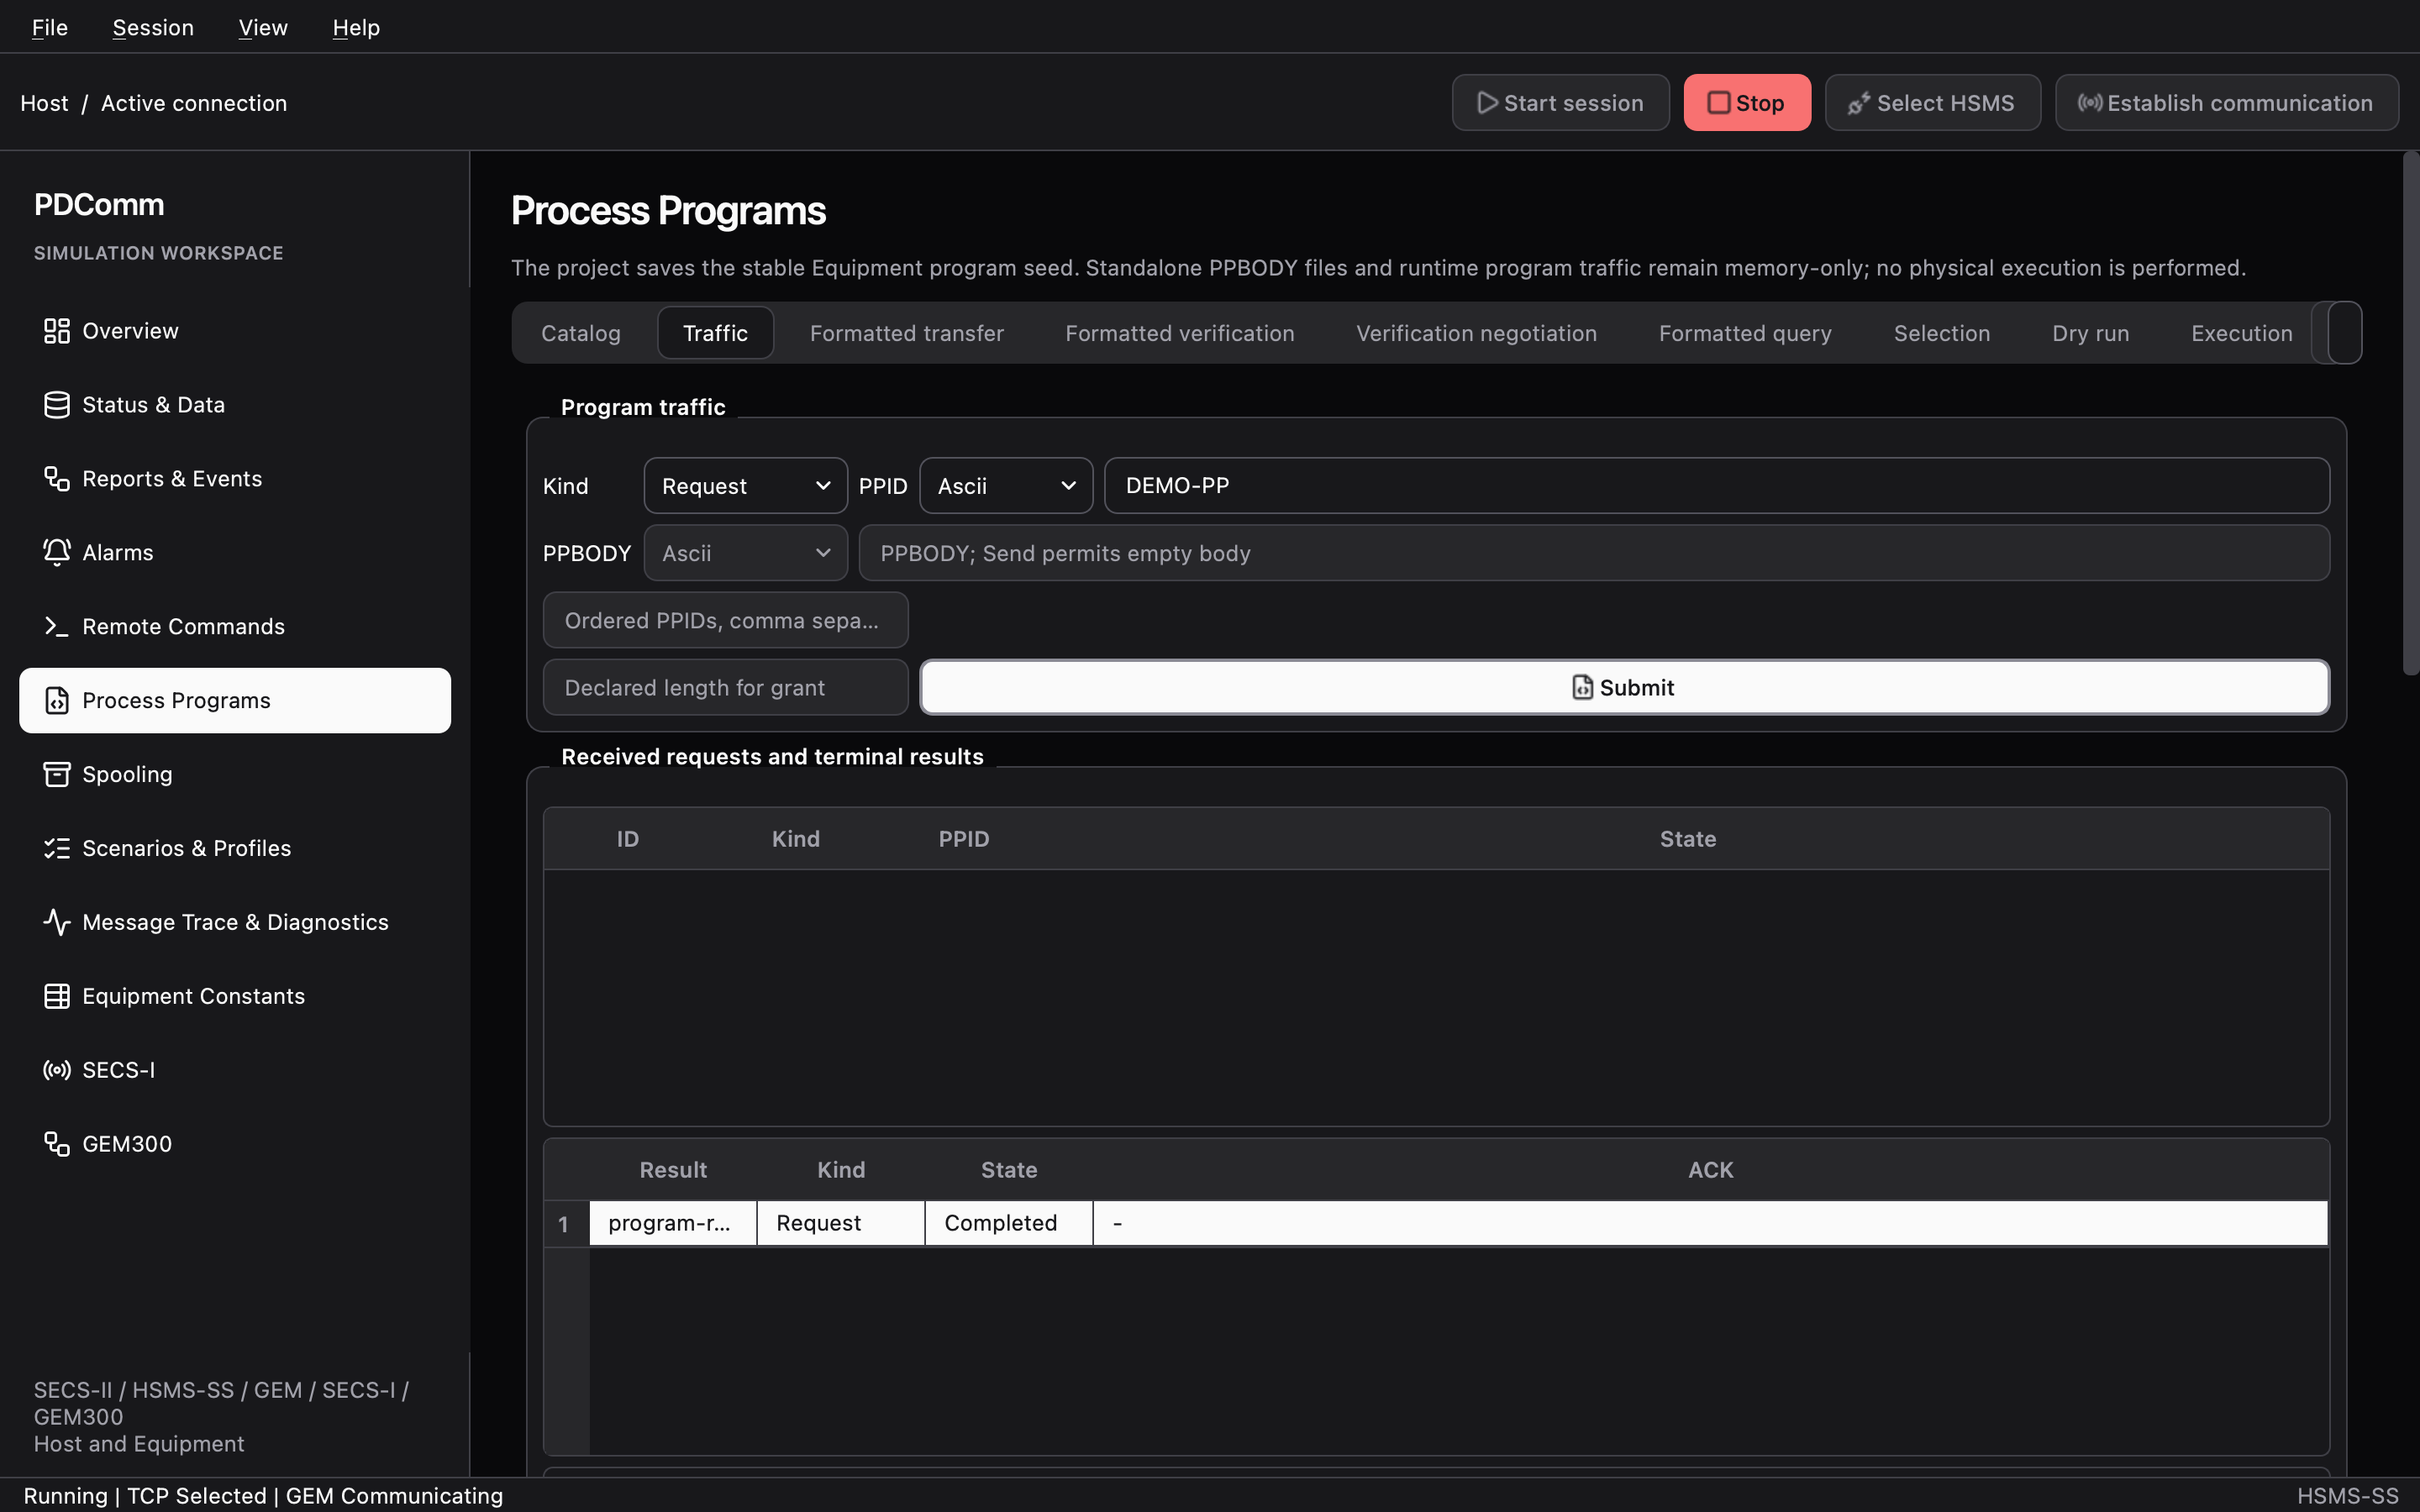
Walkthrough: Process programs
Spooling
Section titled “Spooling”Exercises spooling, where the Equipment keeps messages in memory while it can’t deliver them. The tabs are Configuration, Queue, and Controls & Delivery.
- Configuration (Equipment): pick the spooled streams and functions in Catalog and Selections. Load example adds S5F1 and S6F11 and turns on Enable local spooling. Reserve the configuration with Use on next start.
- Queue (Equipment): put an event or an alarm into the spool queue with Capture event or Capture alarm.
- Controls & Delivery: the Host sends Submit configure (S2F43), Submit query, and Submit data control (S6F23 Transmit or Purge). The Equipment answers with Respond to selected control and delivers the next entry with Send next. A W1 delivery ends with Accept W1 or Reject W1; a W0 delivery ends with Complete W0.
The spool queue lives in memory only and disappears when the simulator exits.
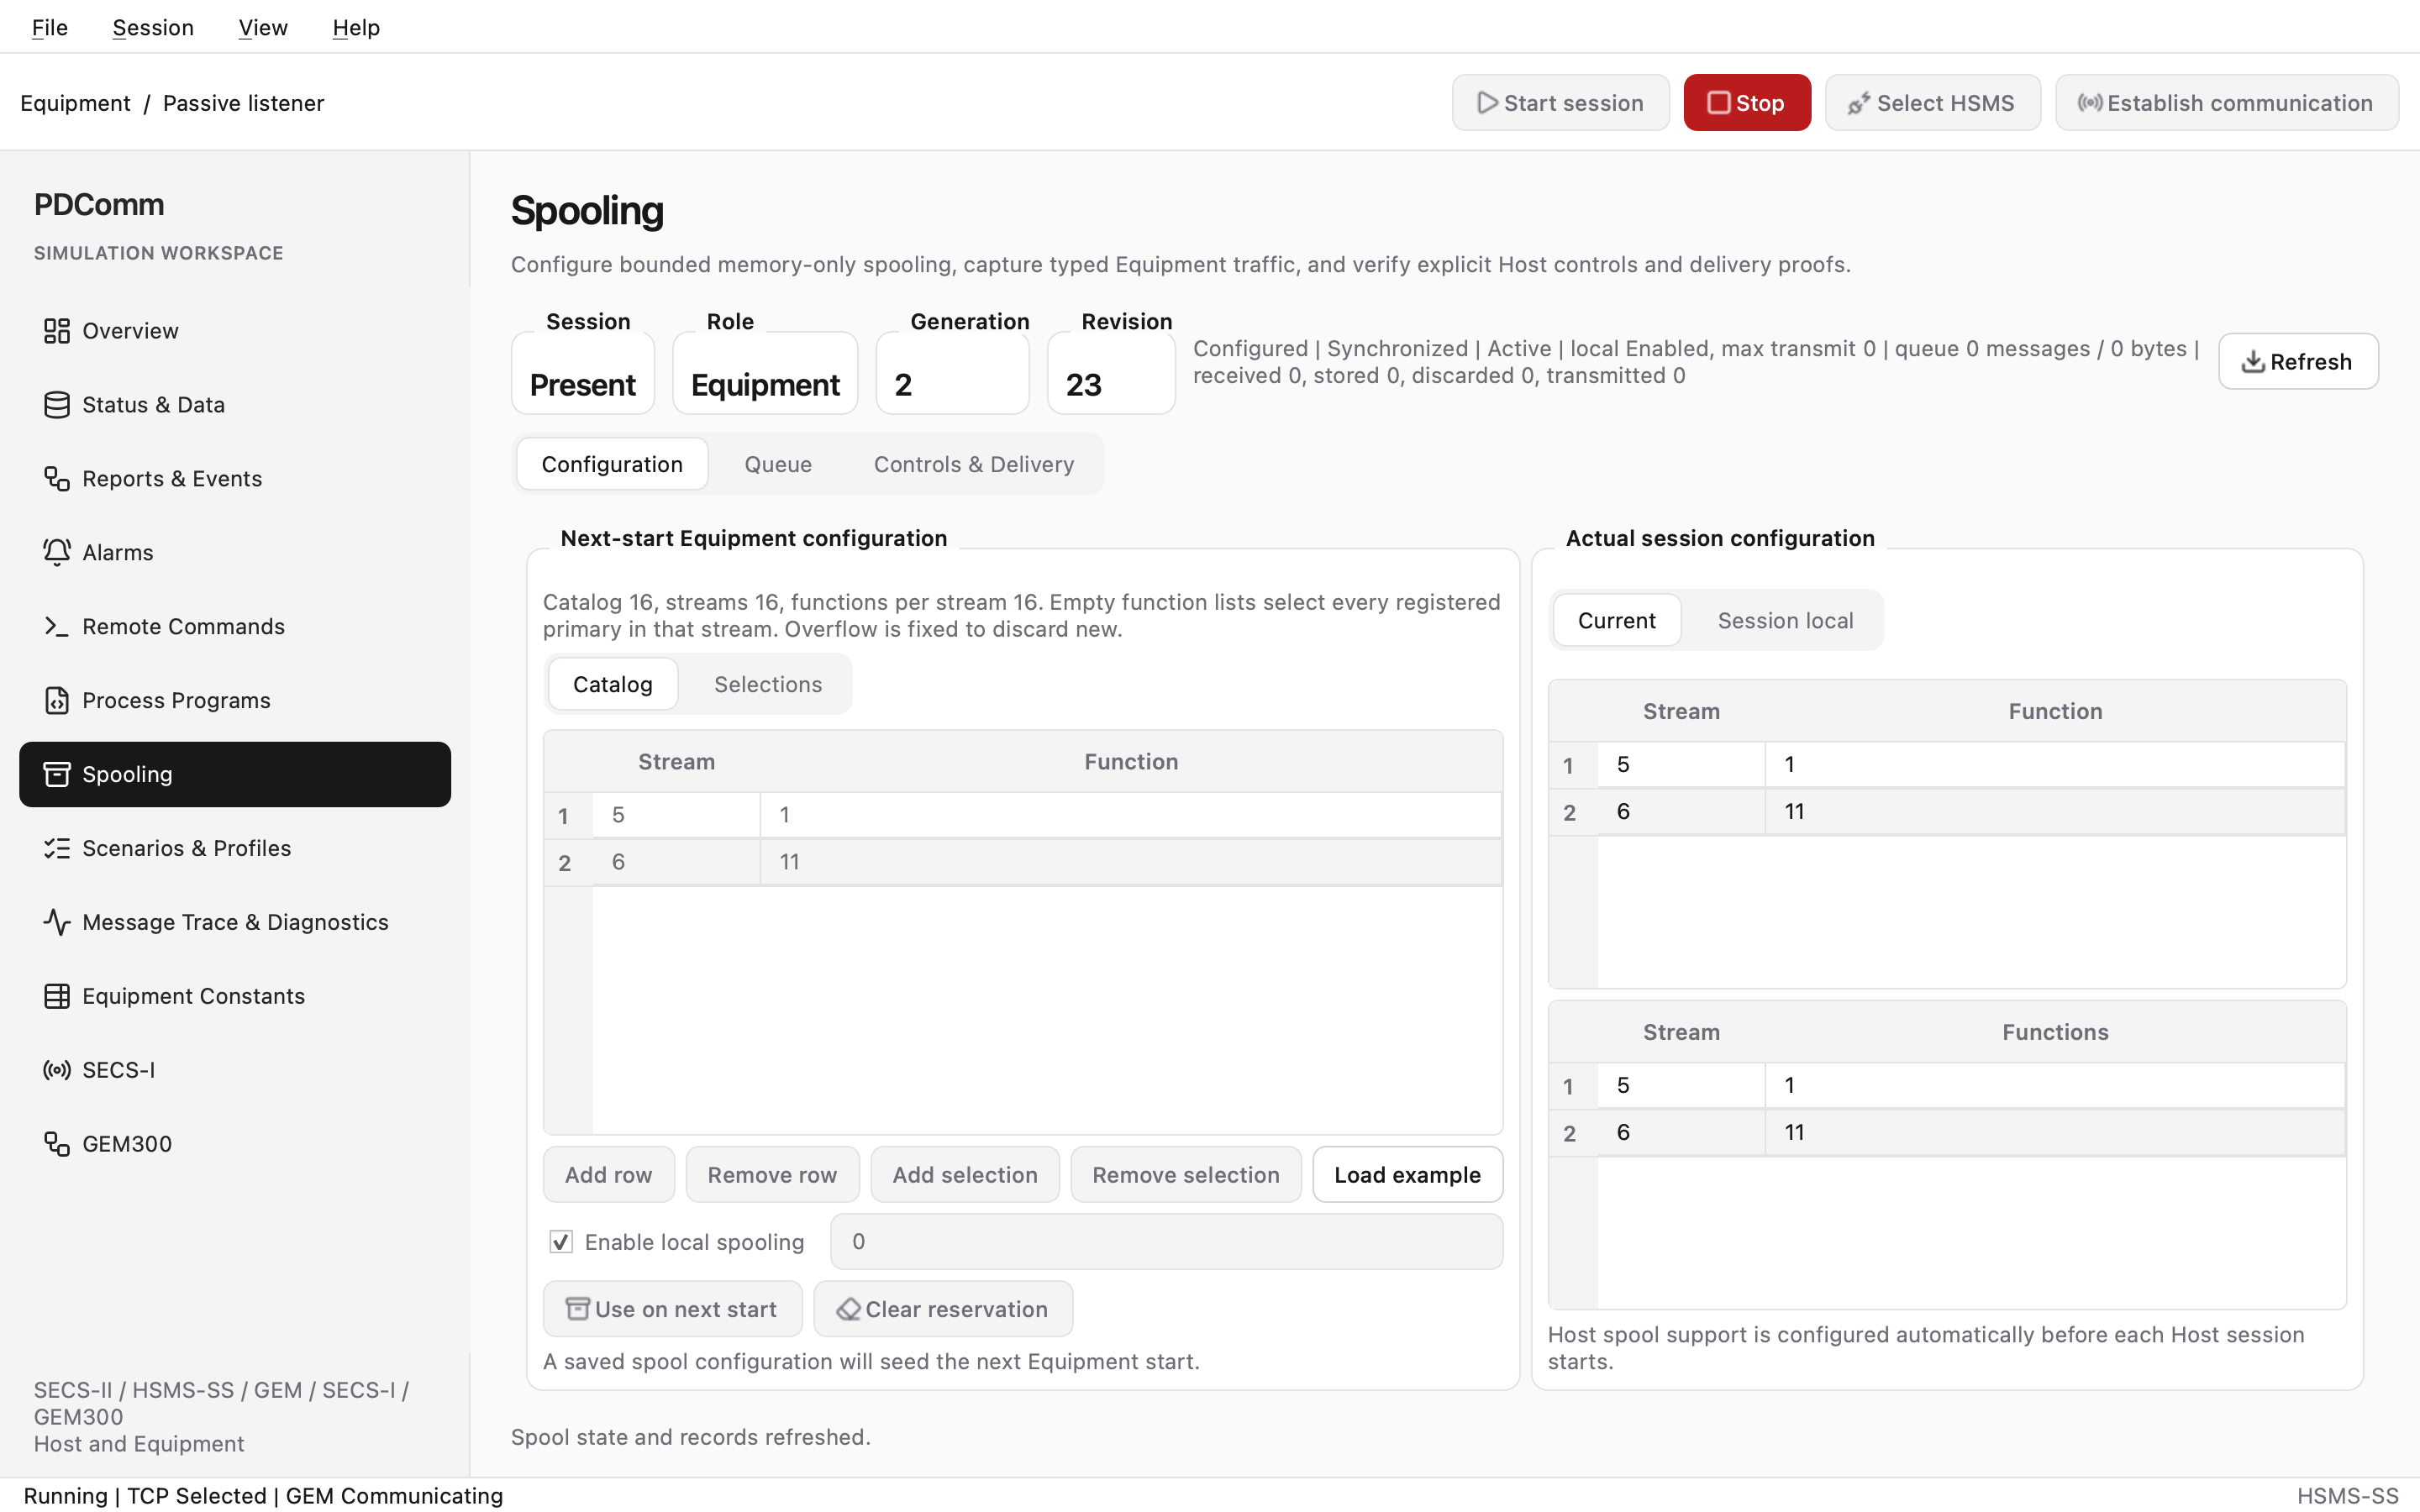
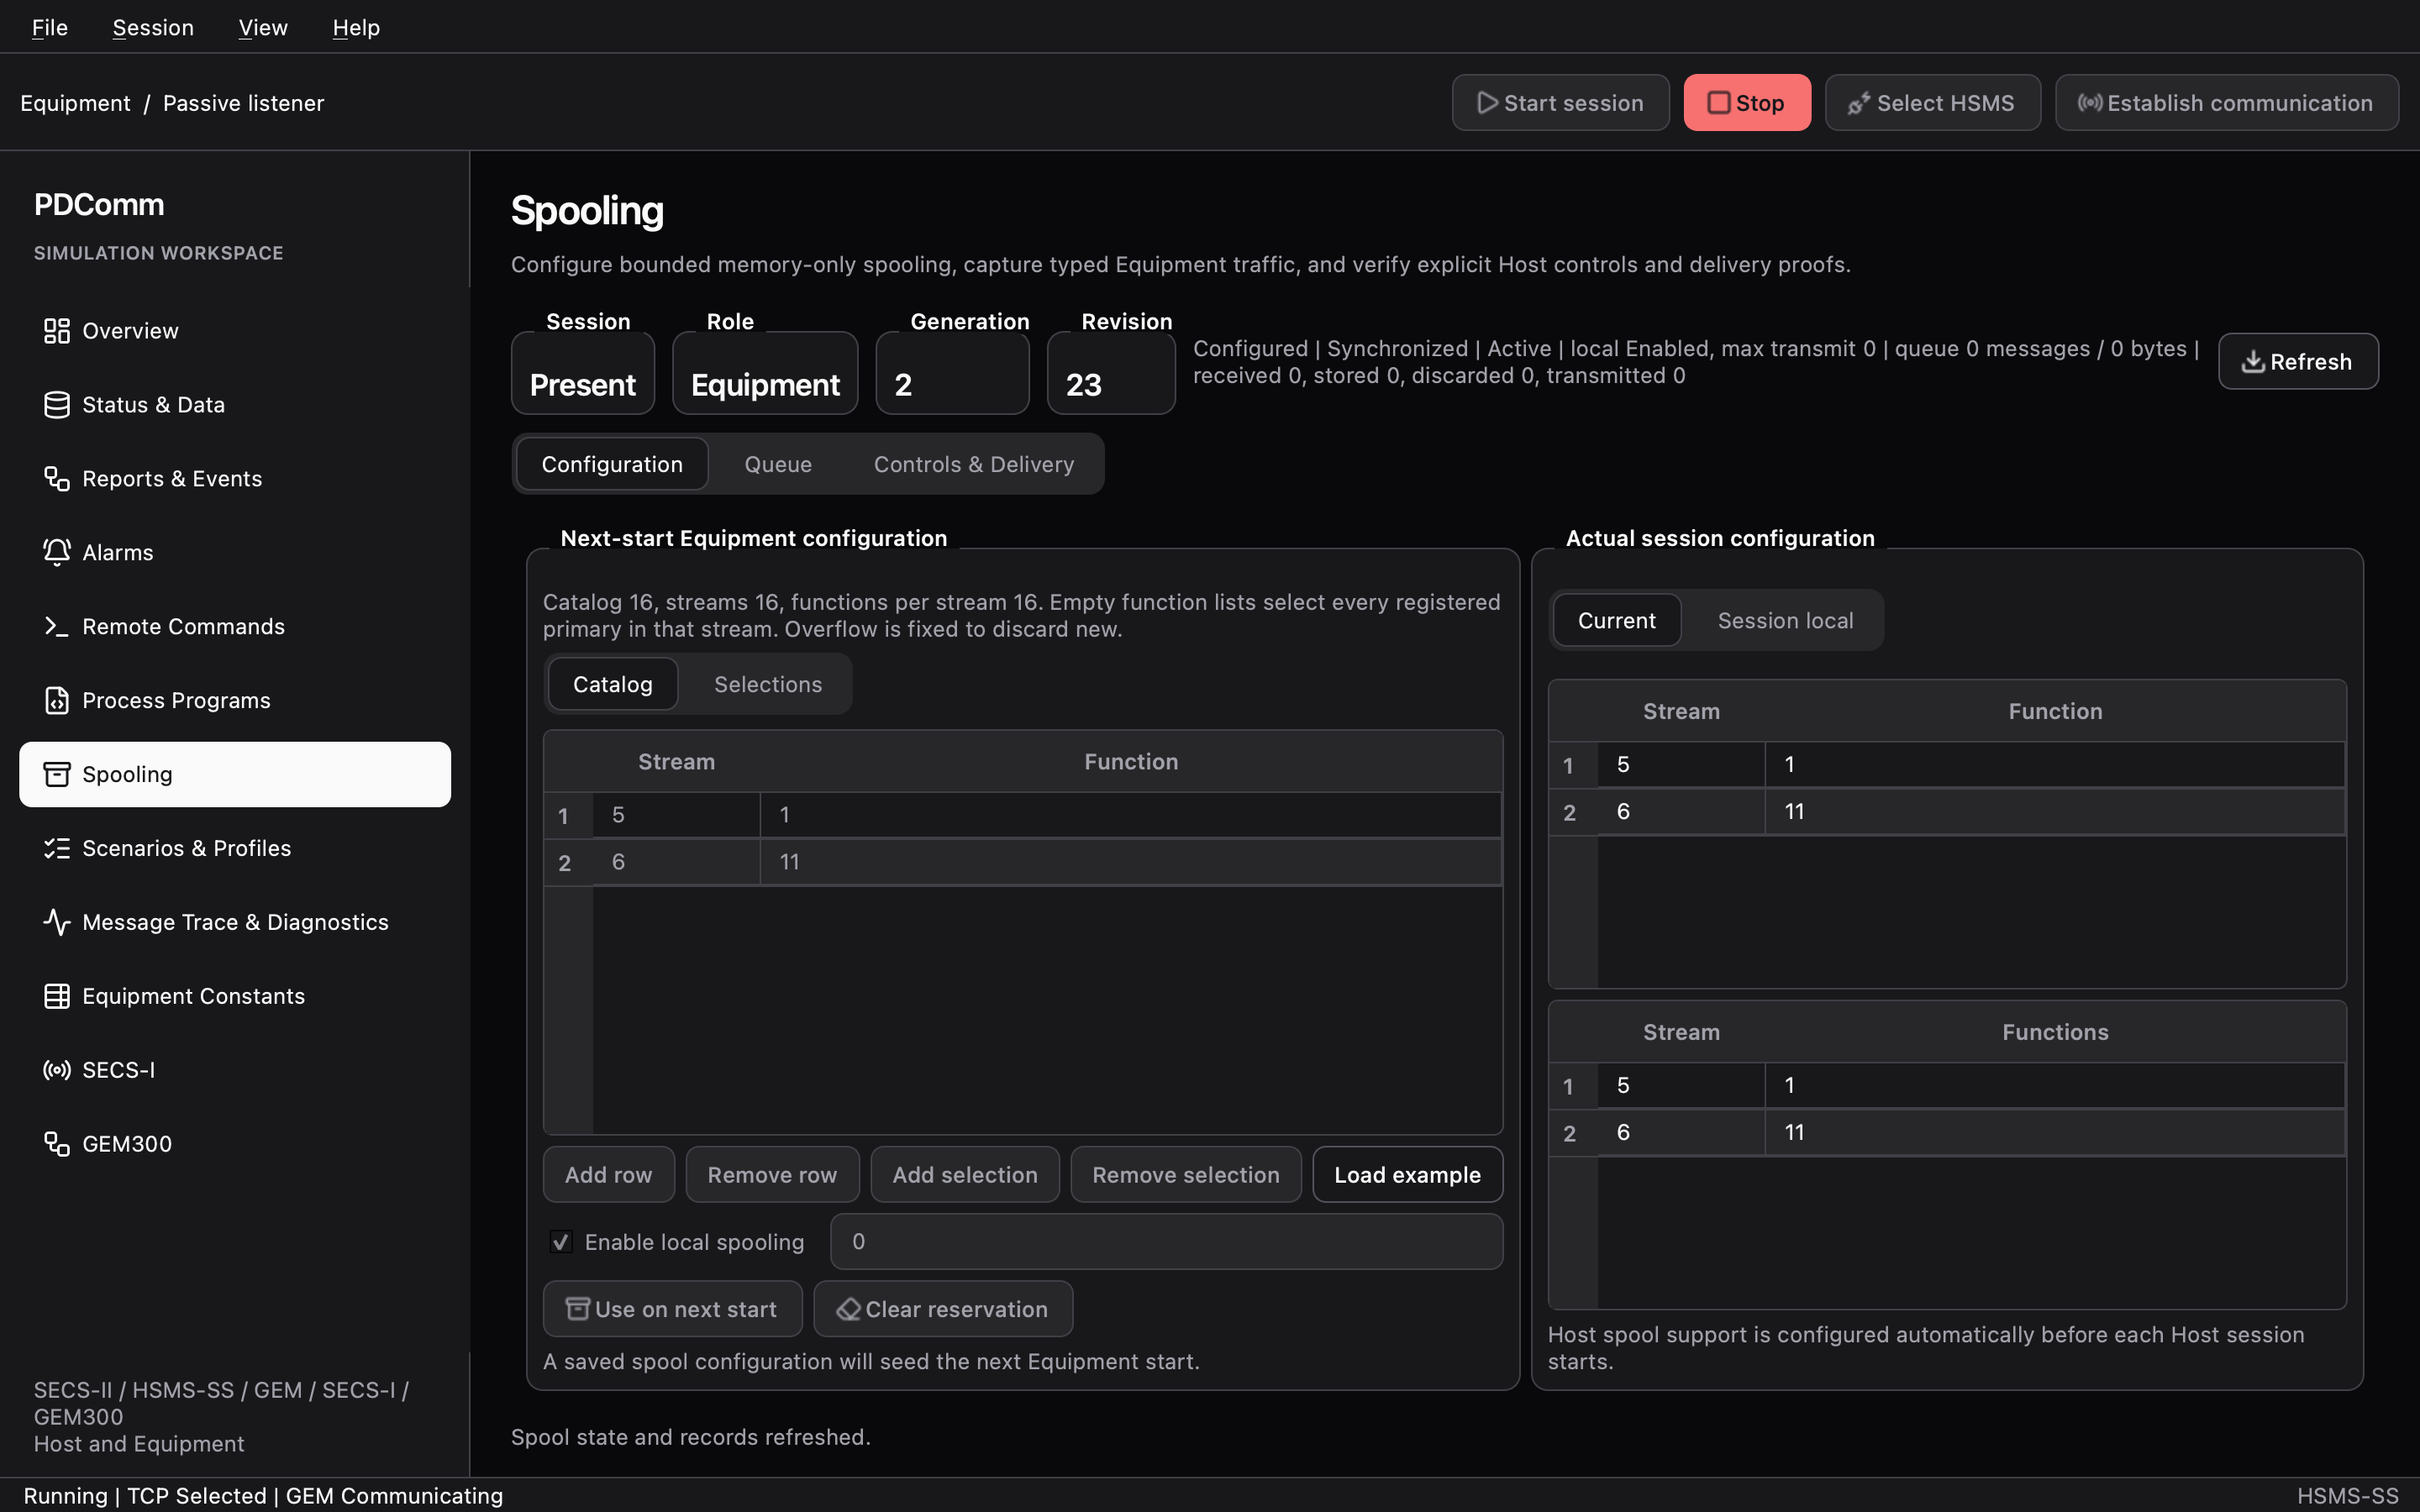
Walkthrough: Spooling
Scenarios & Profiles
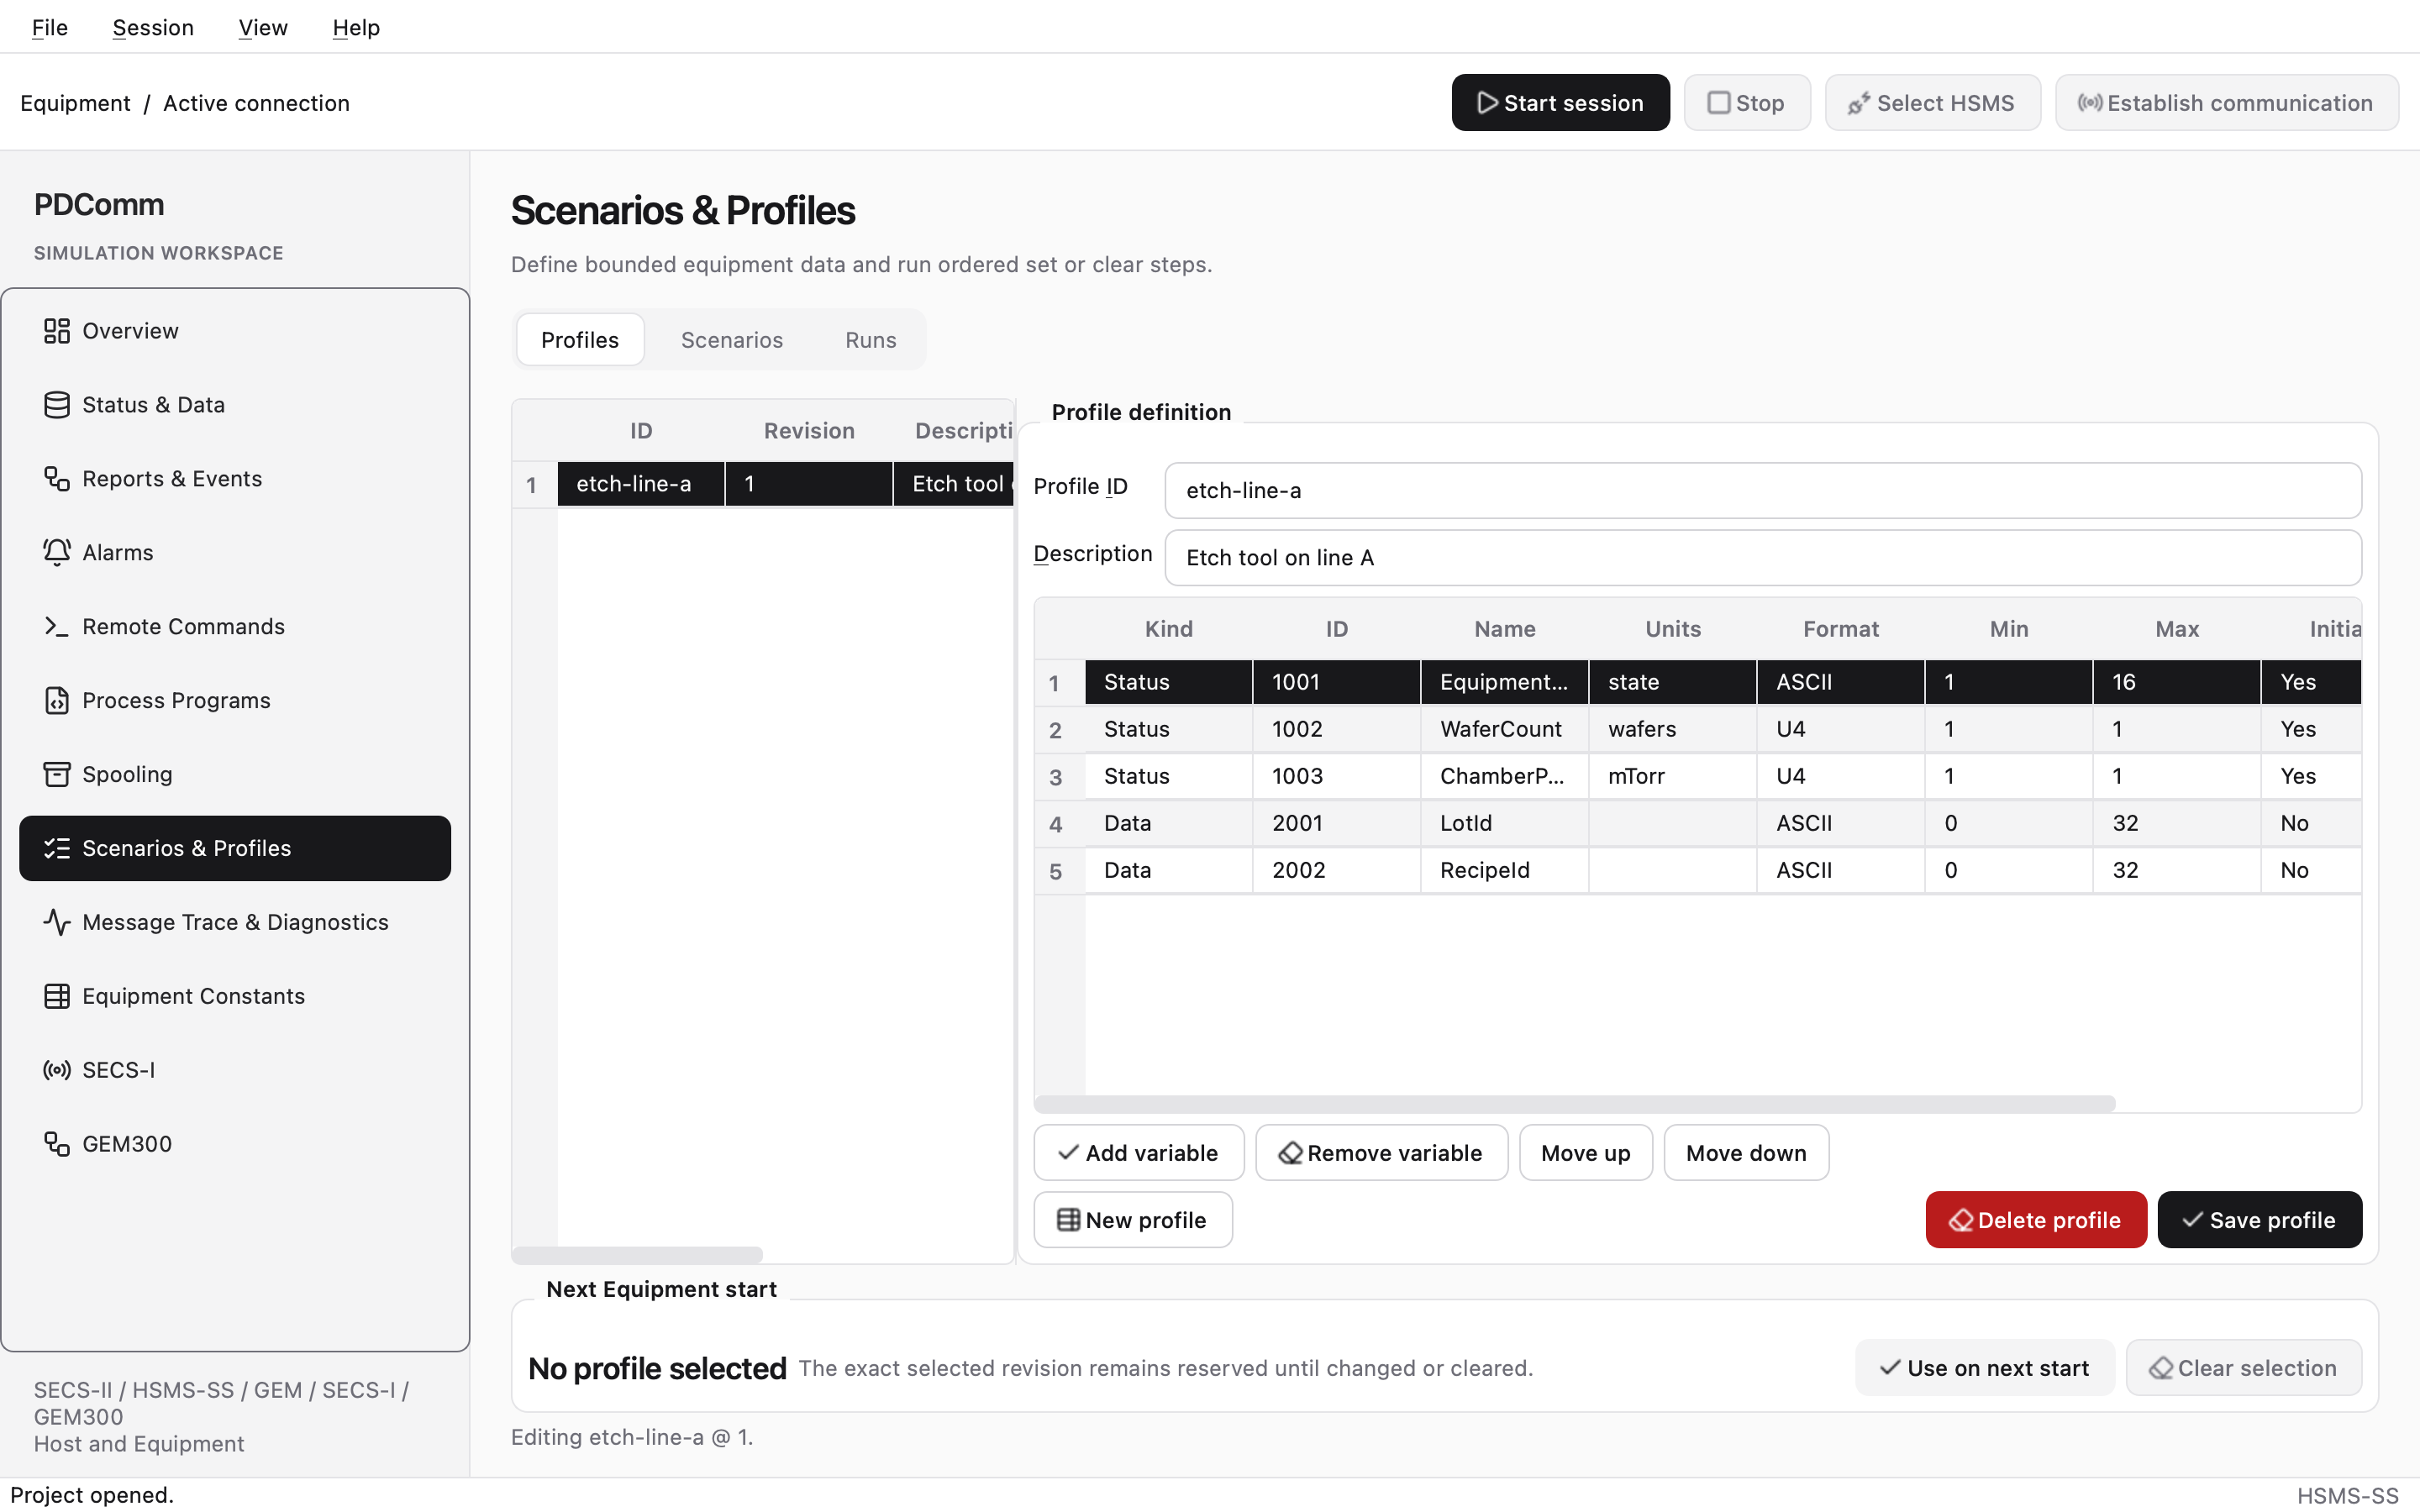
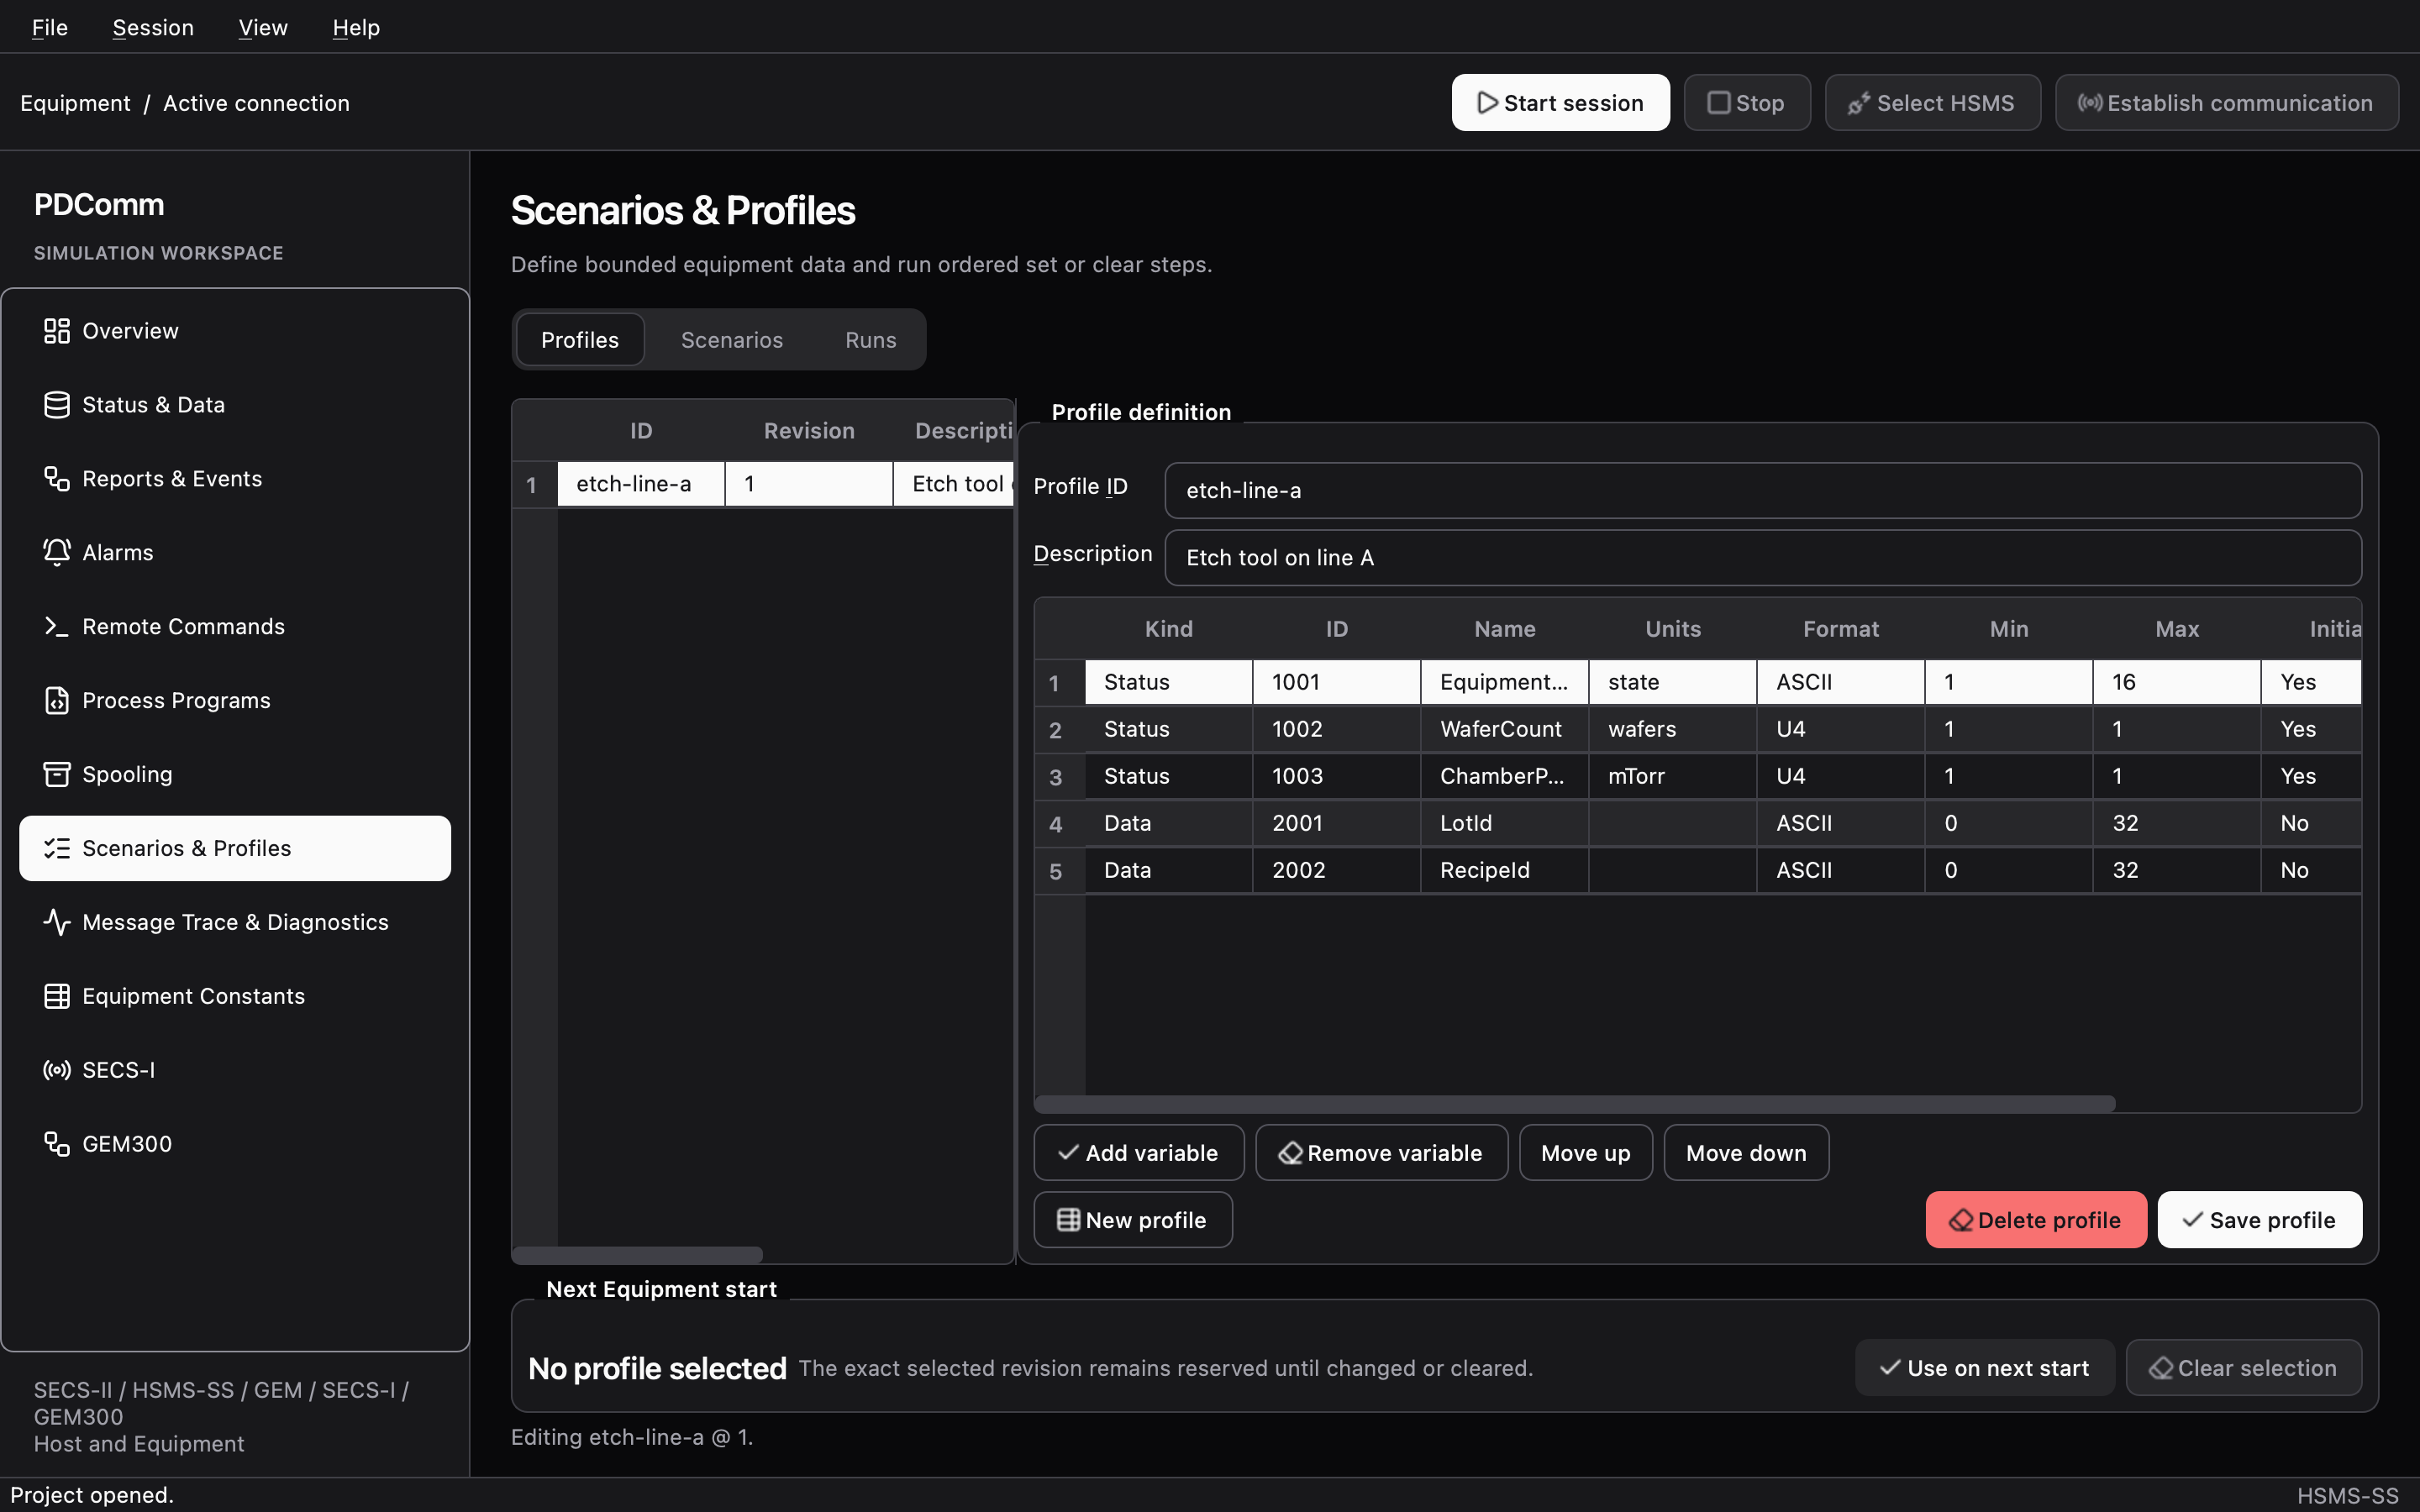
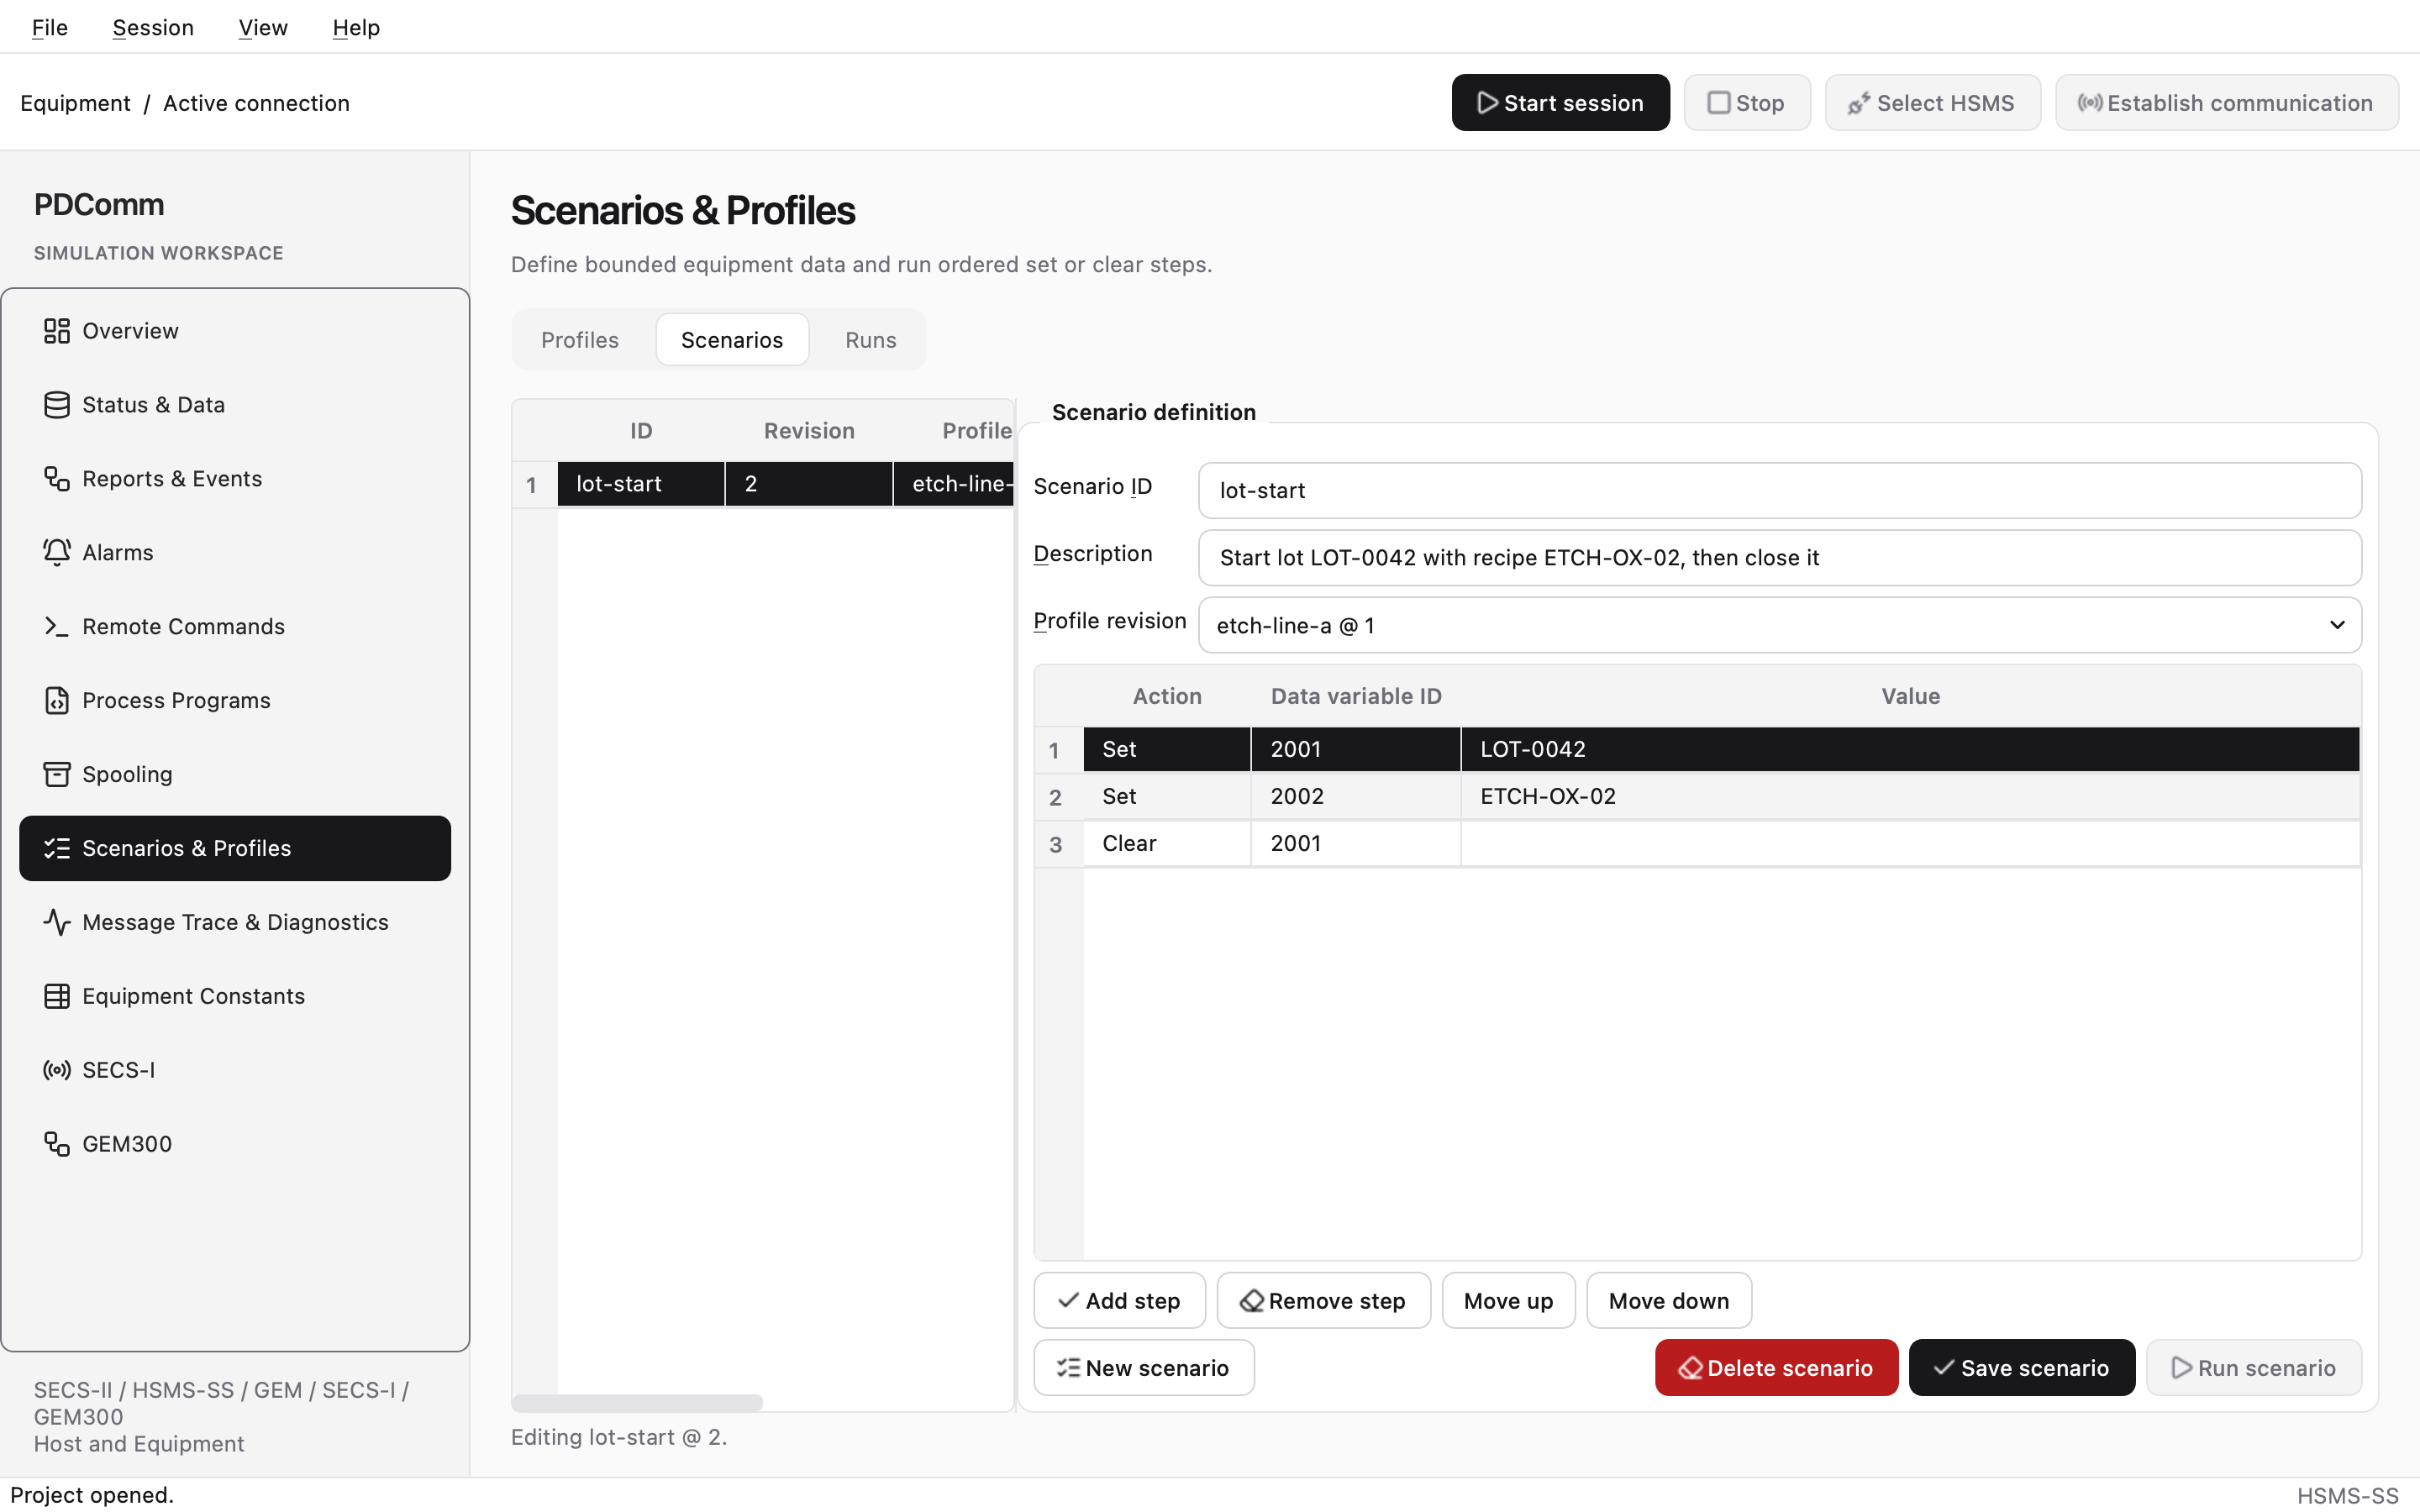
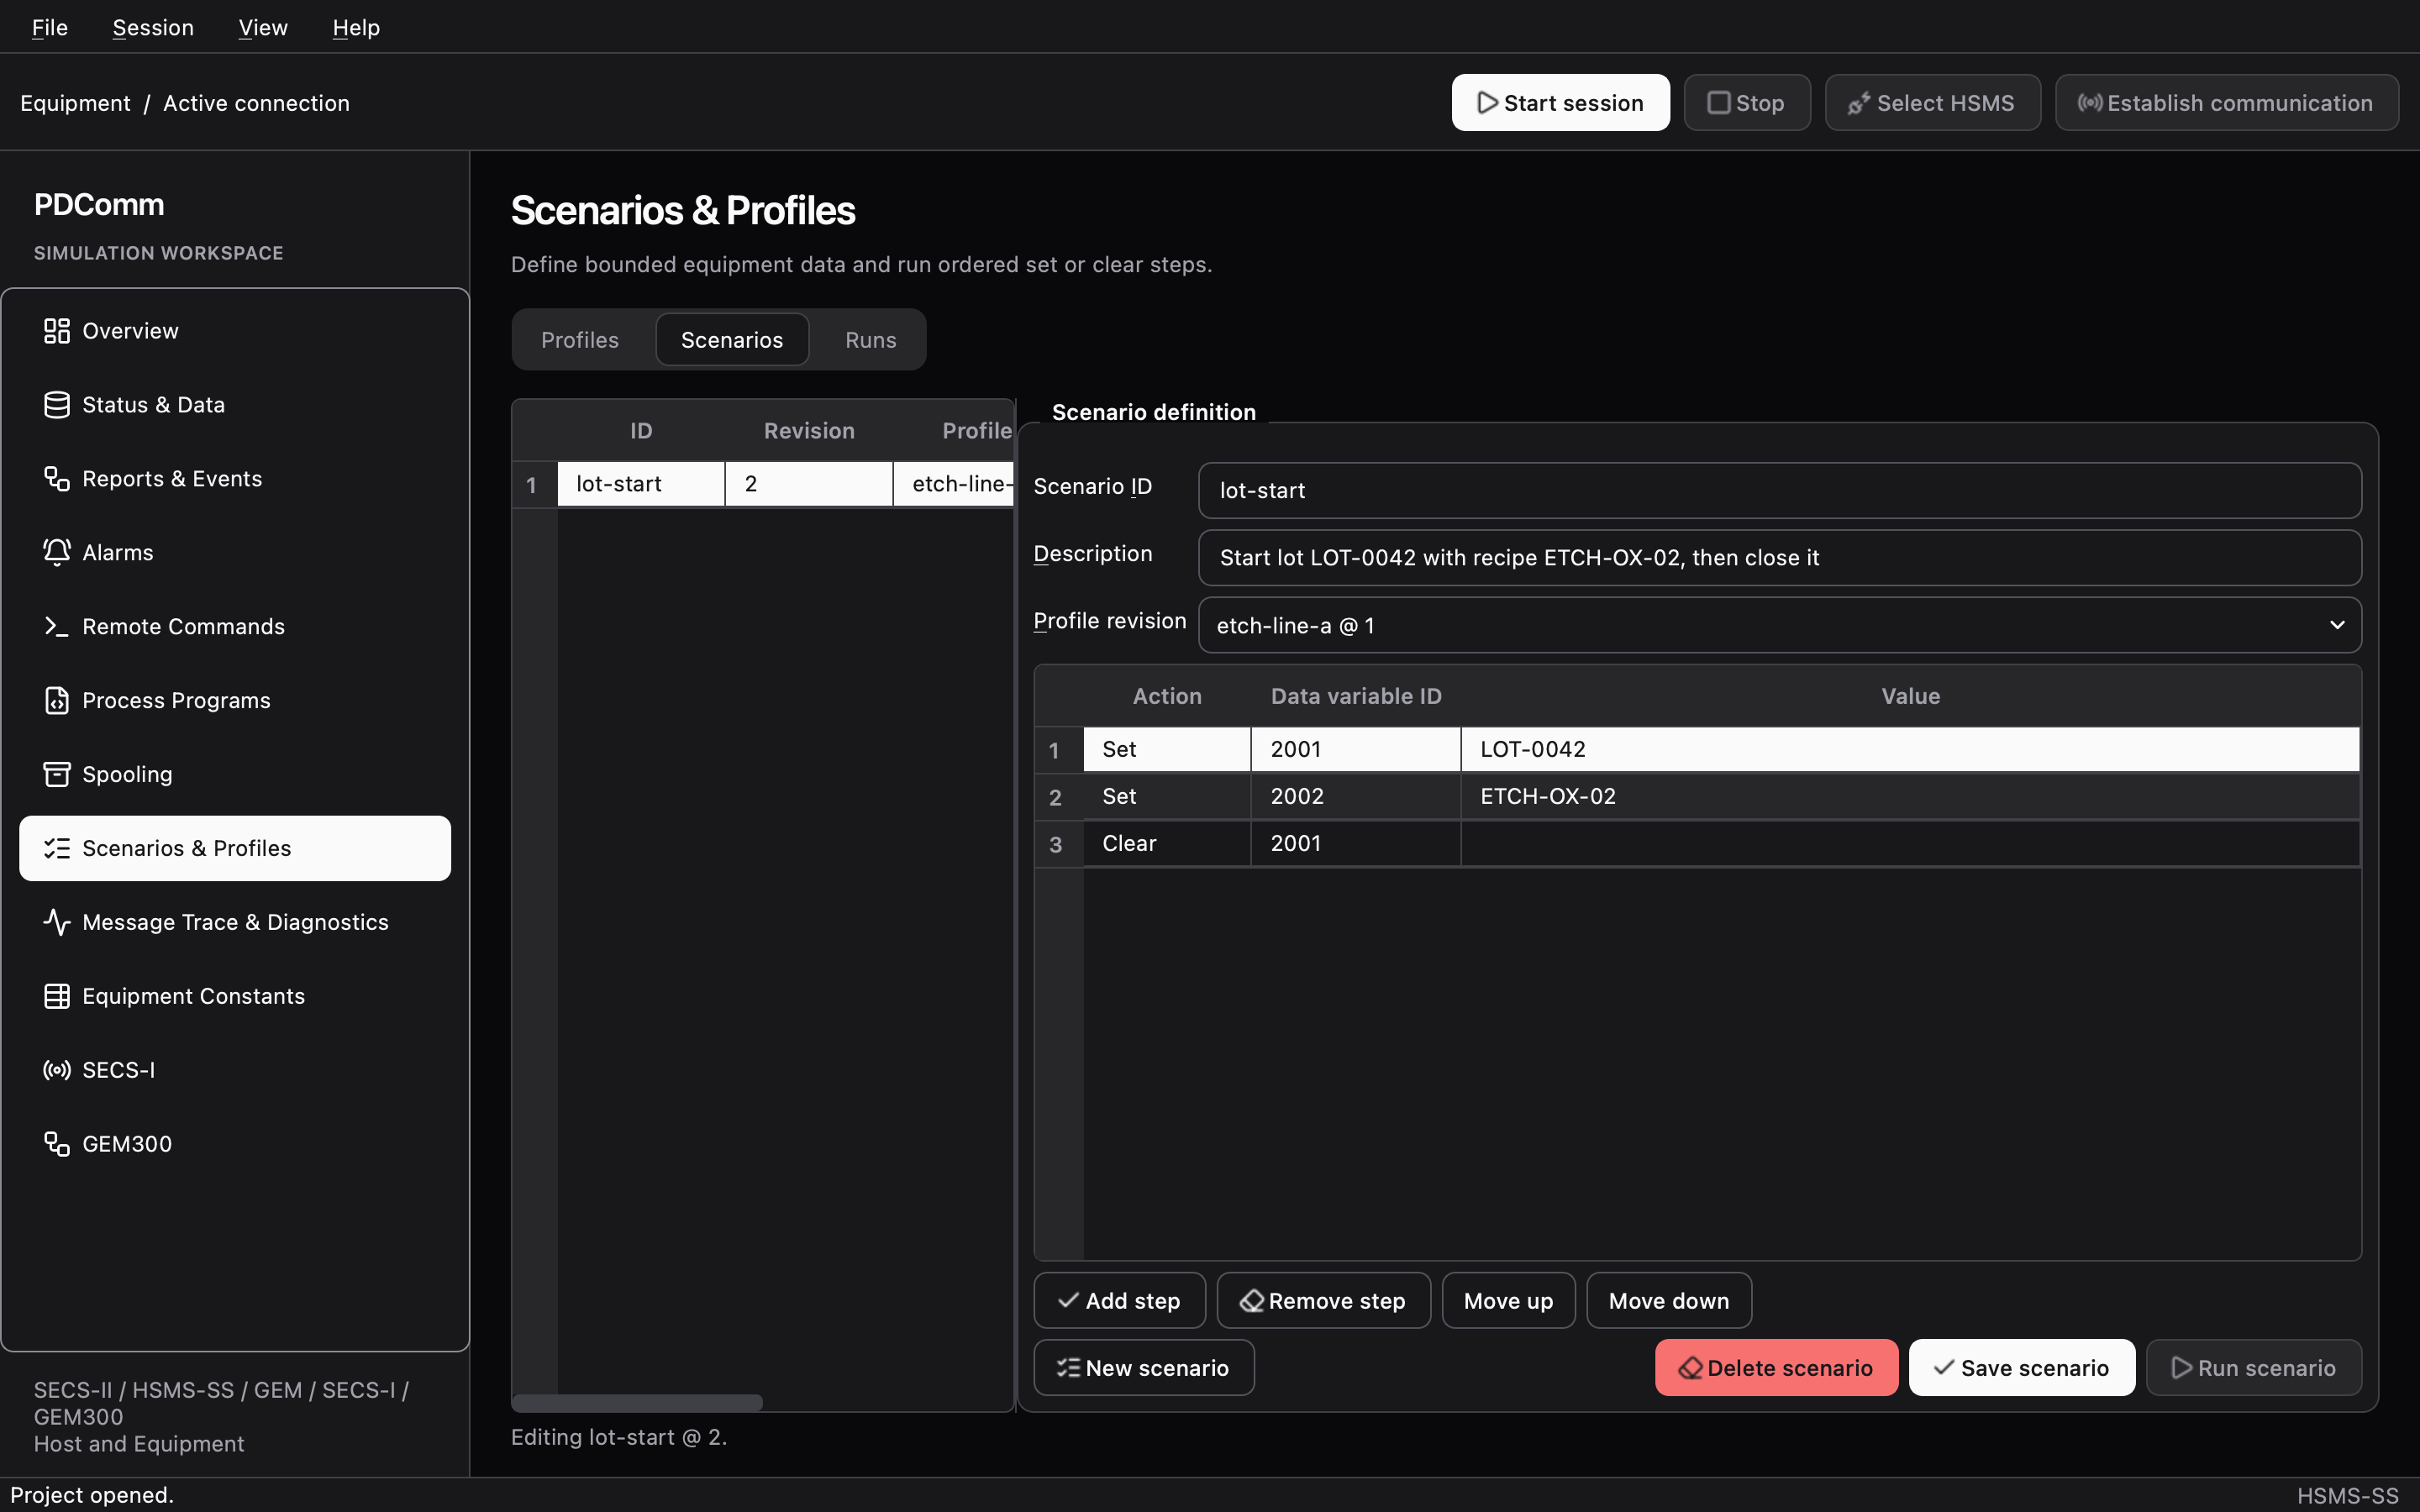
Section titled “Scenarios & Profiles”Manages Equipment data definitions (profiles) and the ordered changes you run on top of them (scenarios). The tabs are Profiles, Scenarios, and Runs.
- Profiles: click New profile and fill in Profile ID and Description. Add variables with Add variable (Kind Status or Data, Format ASCII or U4) and save with Save profile. Use on next start reserves that profile revision for the next Equipment start.
- Scenarios: click New scenario and pick a Profile revision. Add Set or Clear steps with Add step and save with Save scenario.
- Runs: shows the state of a run started with Run scenario (
Running,Passed,Failed, orCancelled) and the result of each step. Cancel active run stops it.
Run scenario is enabled only when the running Equipment session uses exactly the profile ID and revision the scenario is pinned to. You can also run a scenario from a saved project with the --project and --scenario options of the headless simulator.
Message Trace & Diagnostics
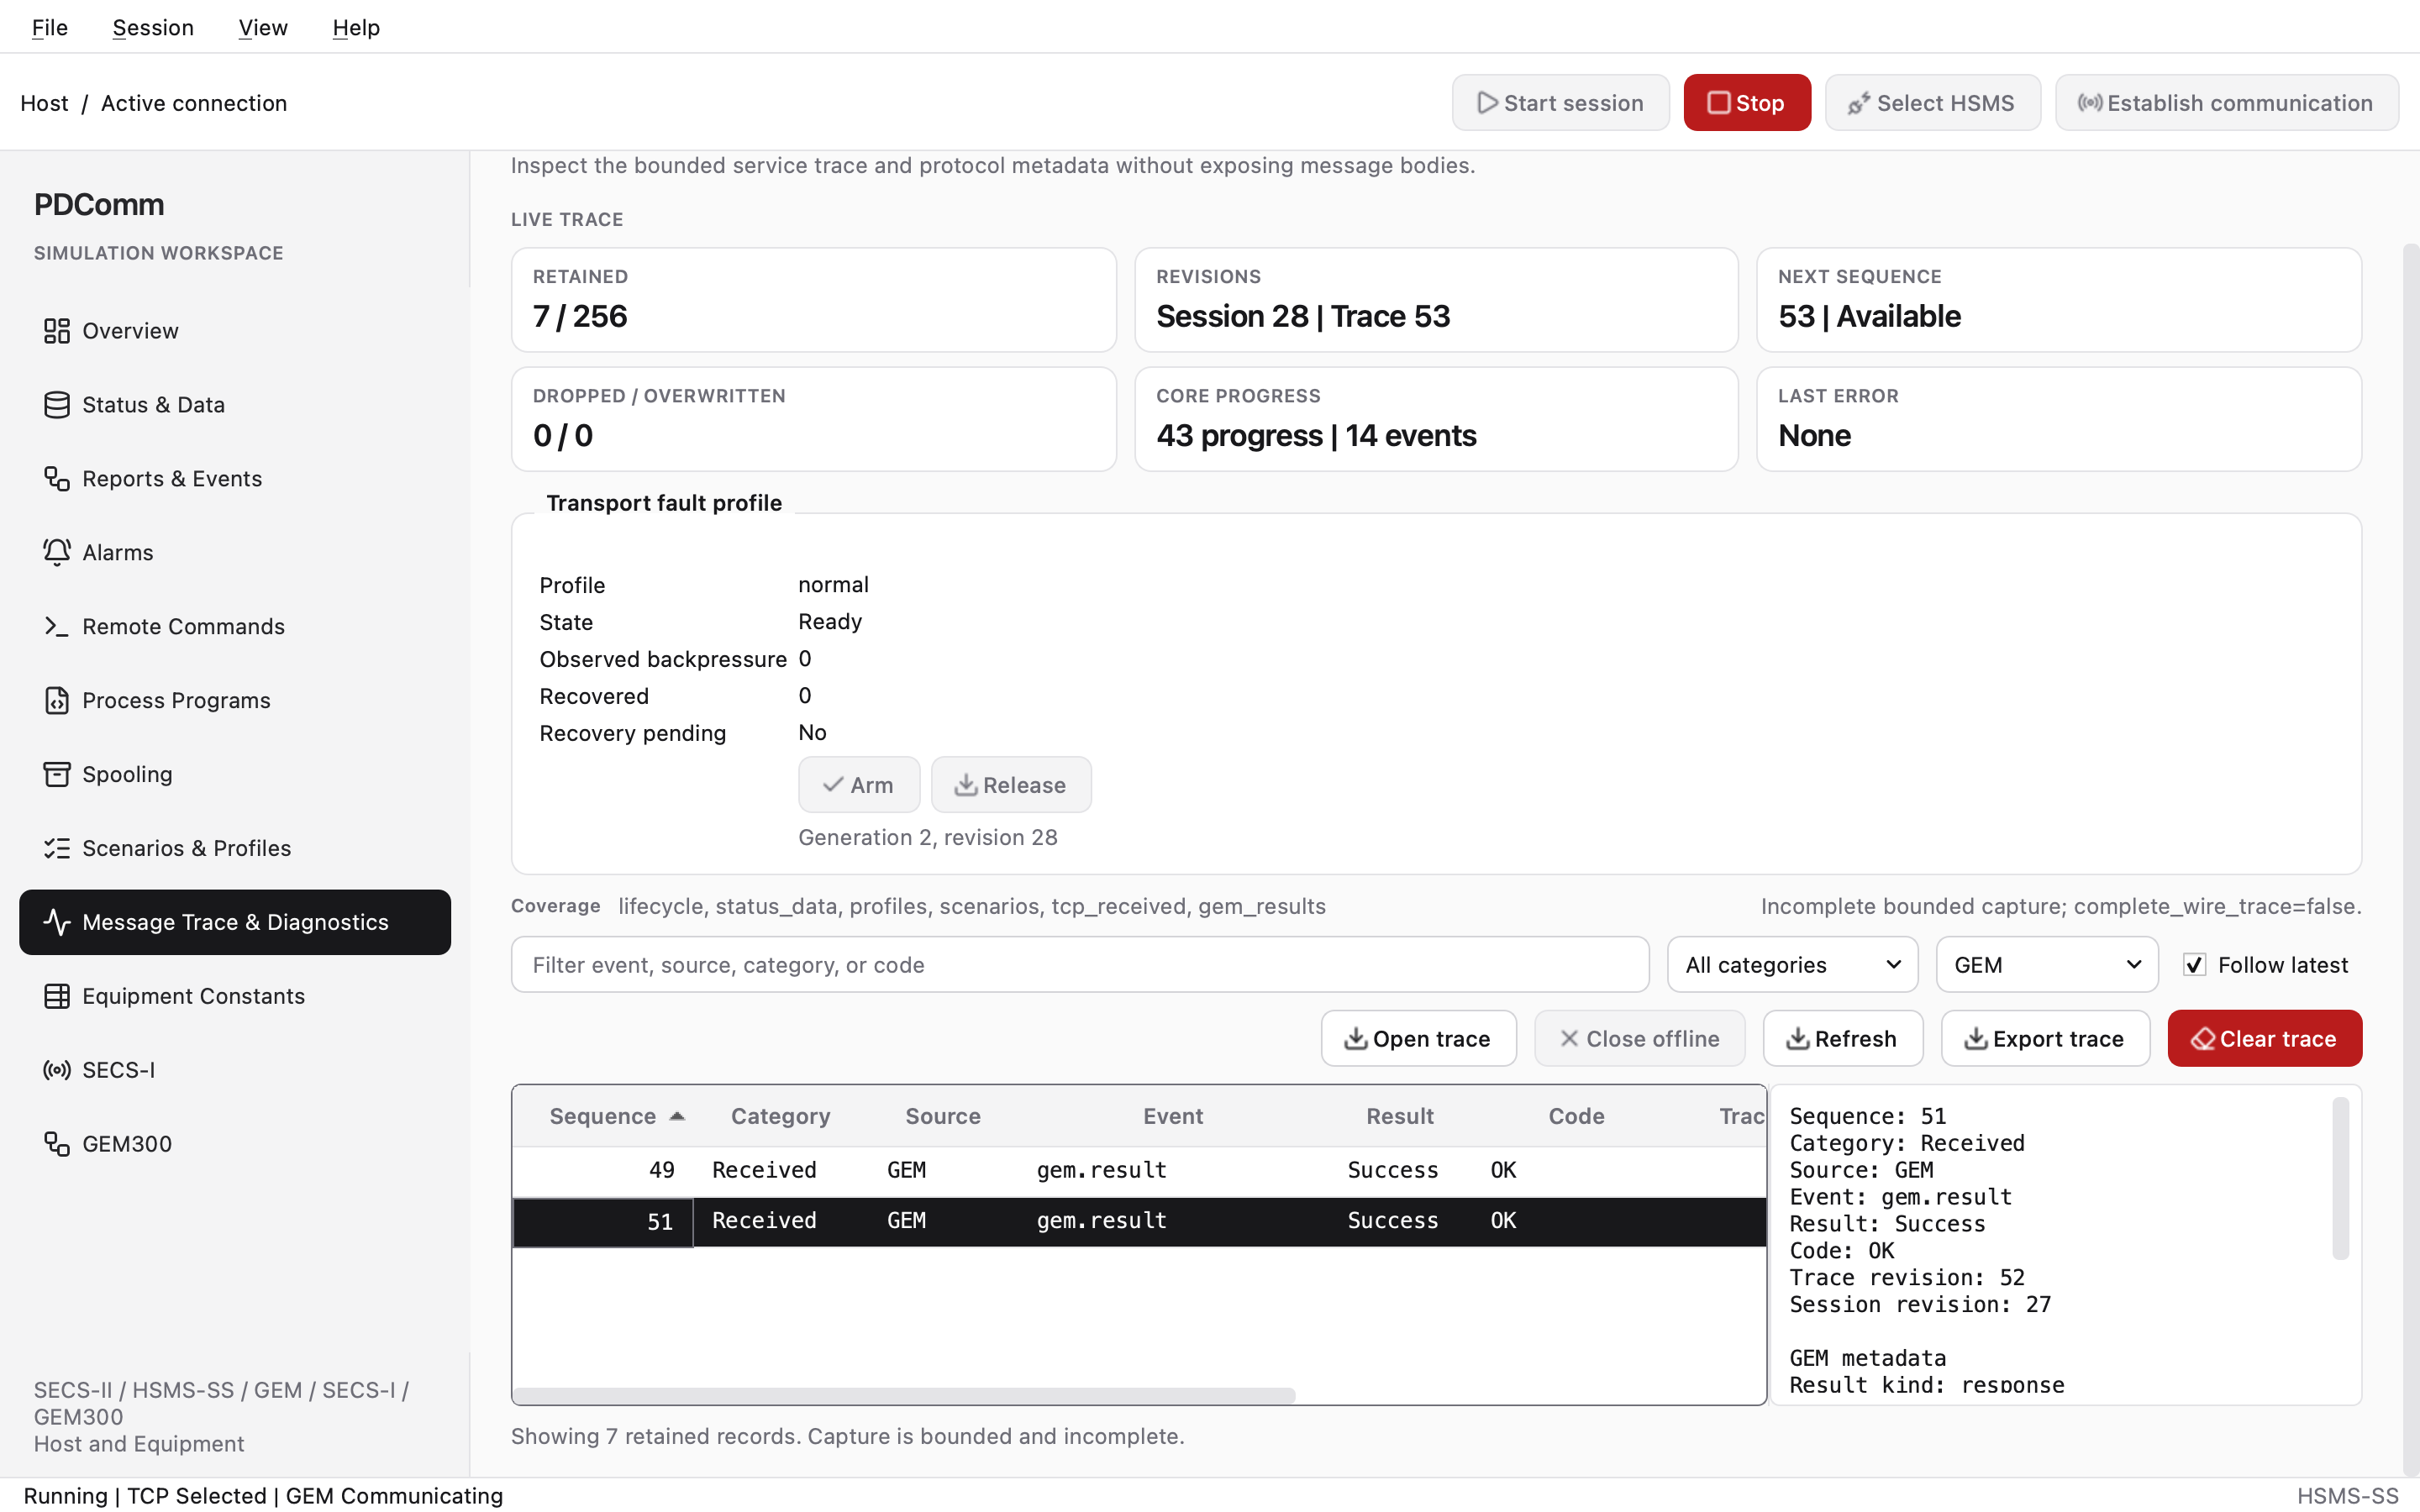
Section titled “Message Trace & Diagnostics”Shows the transaction trace of the session. It records headers and result metadata but never message bodies, and it keeps up to 256 records.
- Cards: RETAINED, REVISIONS, NEXT SEQUENCE, DROPPED / OVERWRITTEN, CORE PROGRESS, and LAST ERROR.
- Filters: a text filter, a category filter (All categories, Activity, Received, Error), a source filter (All sources, Service, TCP, GEM), and Follow latest.
- Buttons: Open trace, Close offline, Refresh, Export trace, and Clear trace.
- The table columns are Sequence, Category, Source, Event, Result, Code, Trace revision, and Session revision. Select a row to see its TCP and GEM metadata below the table.
Export trace saves the current records as a *.pdcomm-trace.json file. When you load a saved file with Open trace, the mode label changes to OFFLINE TRACE · READ ONLY, and new traffic no longer changes the view. Close offline returns to the live trace. The trace is a bounded observation aid: a missing row doesn’t prove that a message was never sent.
The Transport fault profile group arms (Arm) and releases (Release) a write stall on a session that you started with Transport fault set to Write backpressure on Overview. Arm is enabled while the session runs, is selected, and is communicating.
Walkthroughs: Simulator automation and error reproduction and Diagnostics logging
Equipment Constants
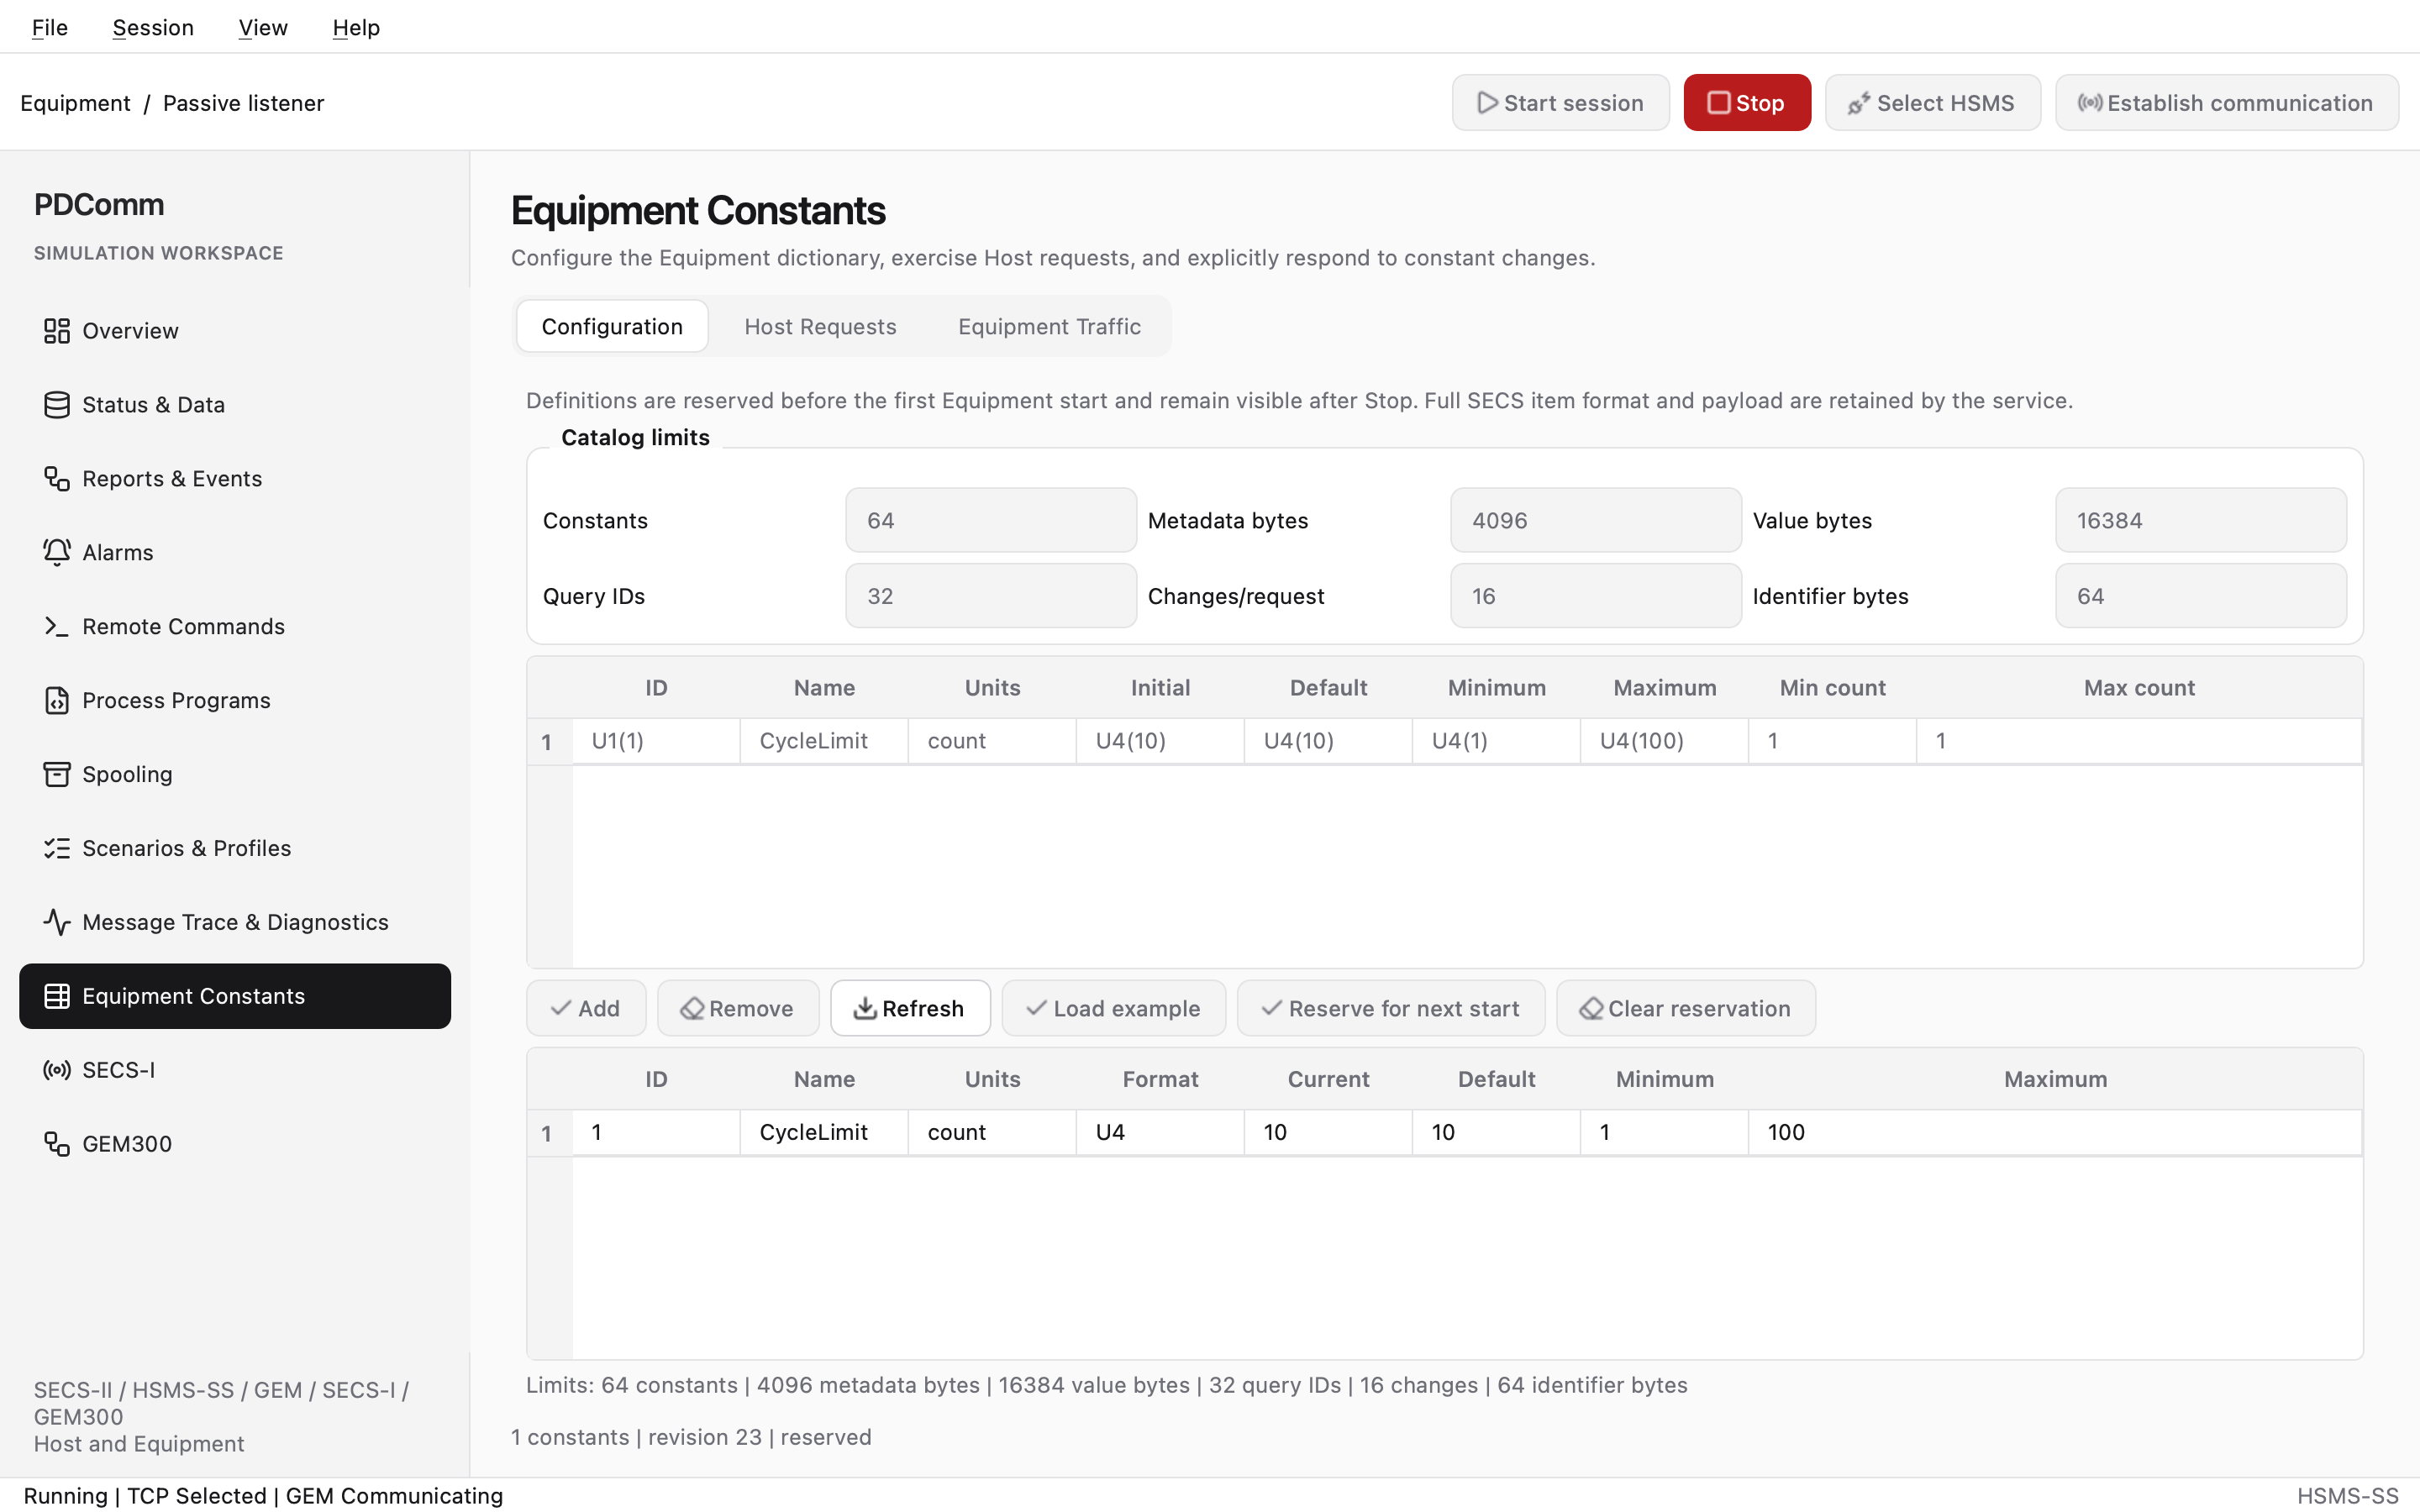
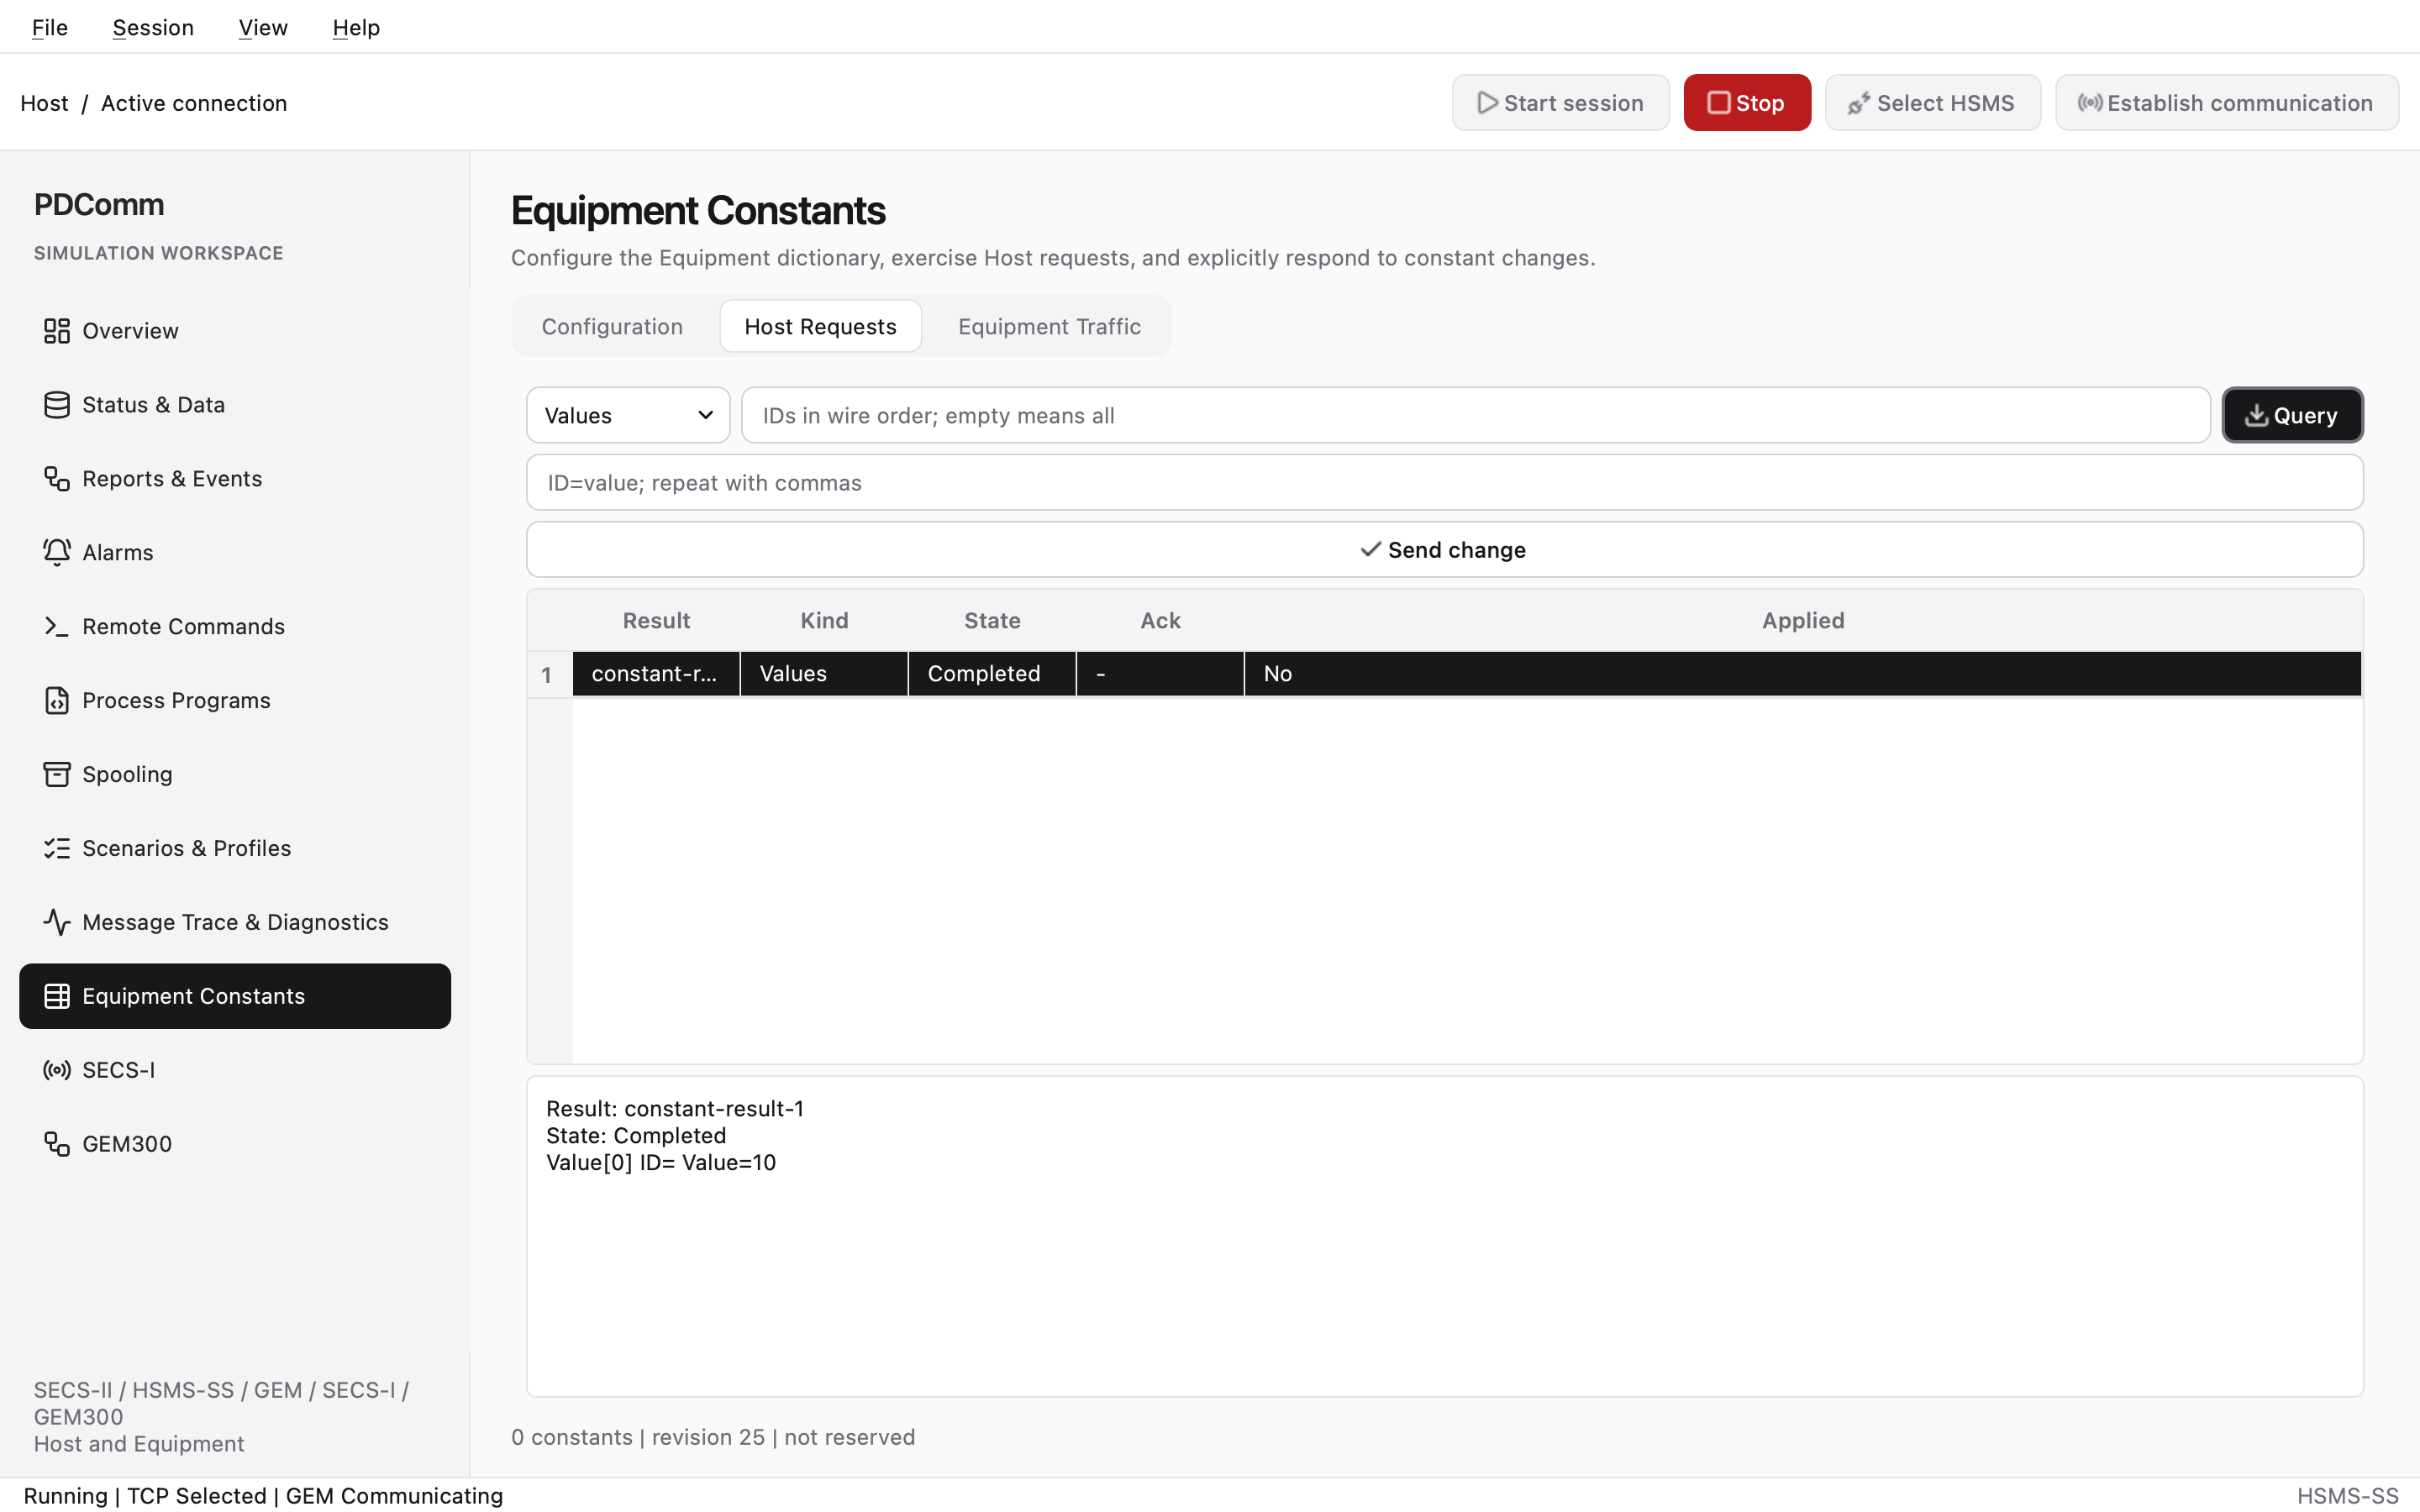
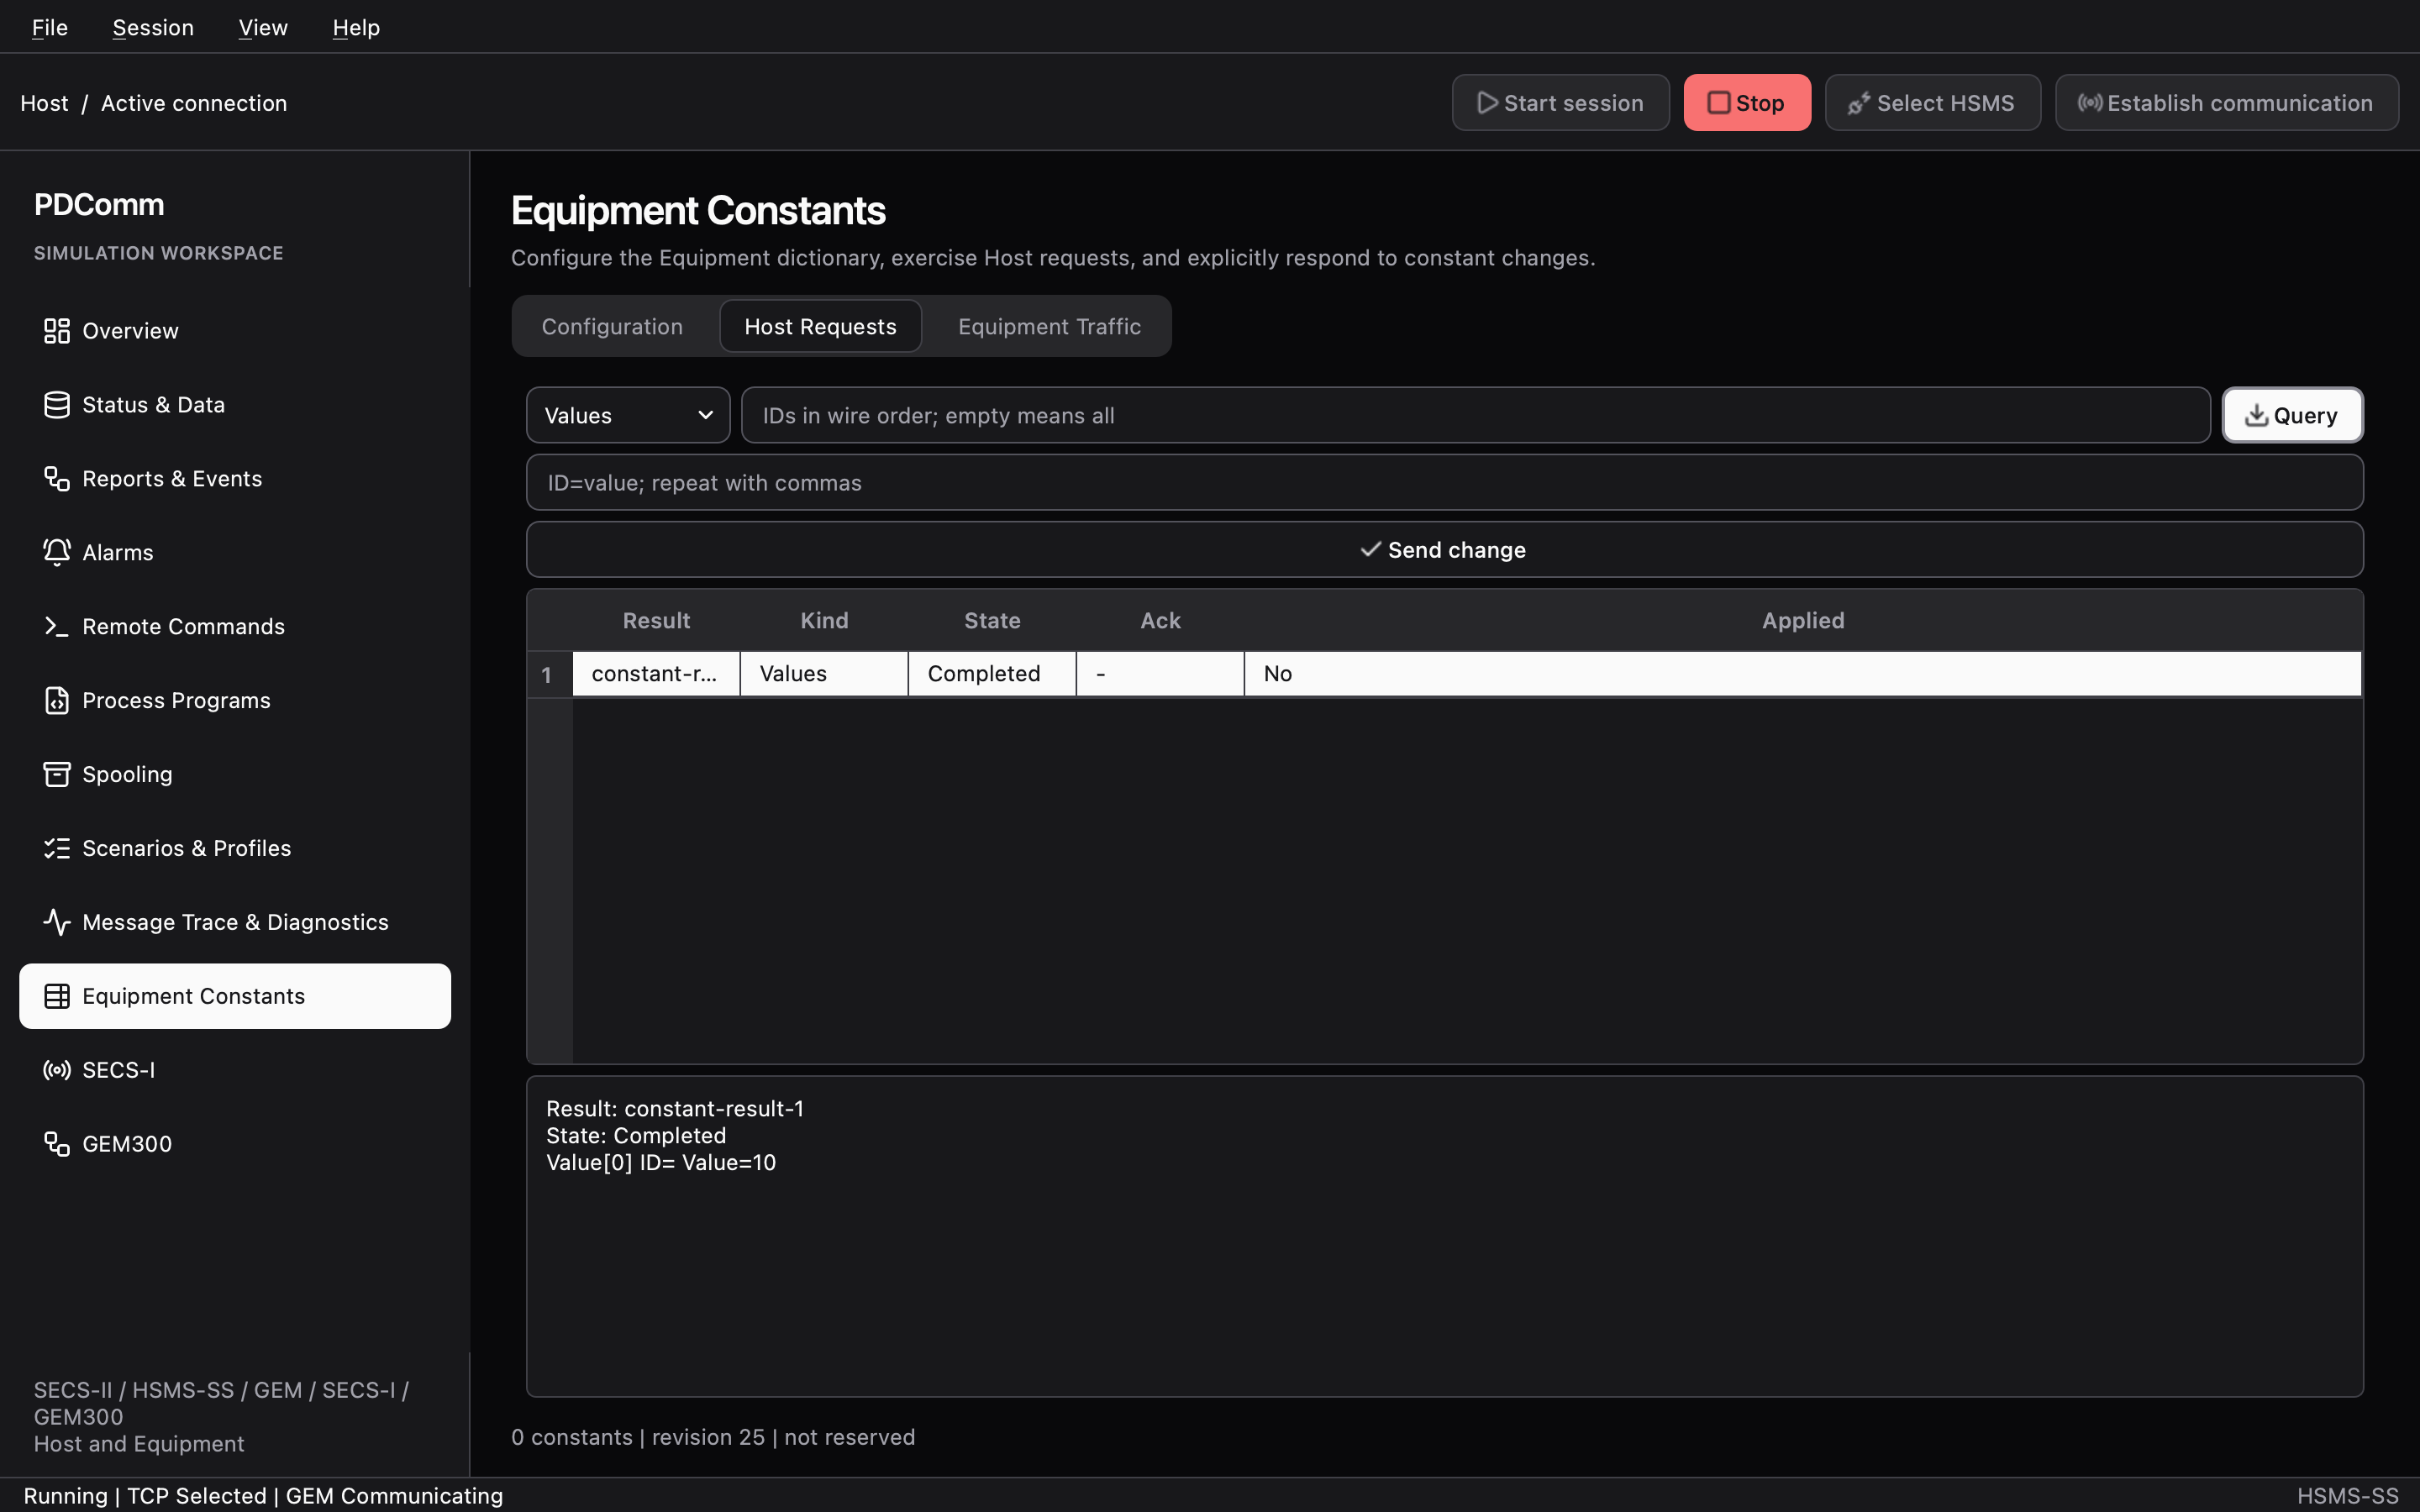
Section titled “Equipment Constants”Covers equipment constants (ECs). The tabs are Configuration, Host Requests, and Equipment Traffic. Host Requests is enabled in the Host role and Equipment Traffic in the Equipment role.
- Configuration (Equipment): edit the constant catalog. Load example adds ID
U1(1)namedCycleLimit(unitscount, initial and default valueU4(10), rangeU4(1)toU4(100)). Reserve it with Reserve for next start. - Host Requests: choose Values or Metadata and click Query to send S2F13 or S2F29. Send change sends a change (S2F15) written as
ID=value. - Equipment Traffic: select a received change request and click Respond with Apply (0), Cannot perform (2), Out of range (3), or Reject (4).
Walkthrough: Data collection
SECS-I
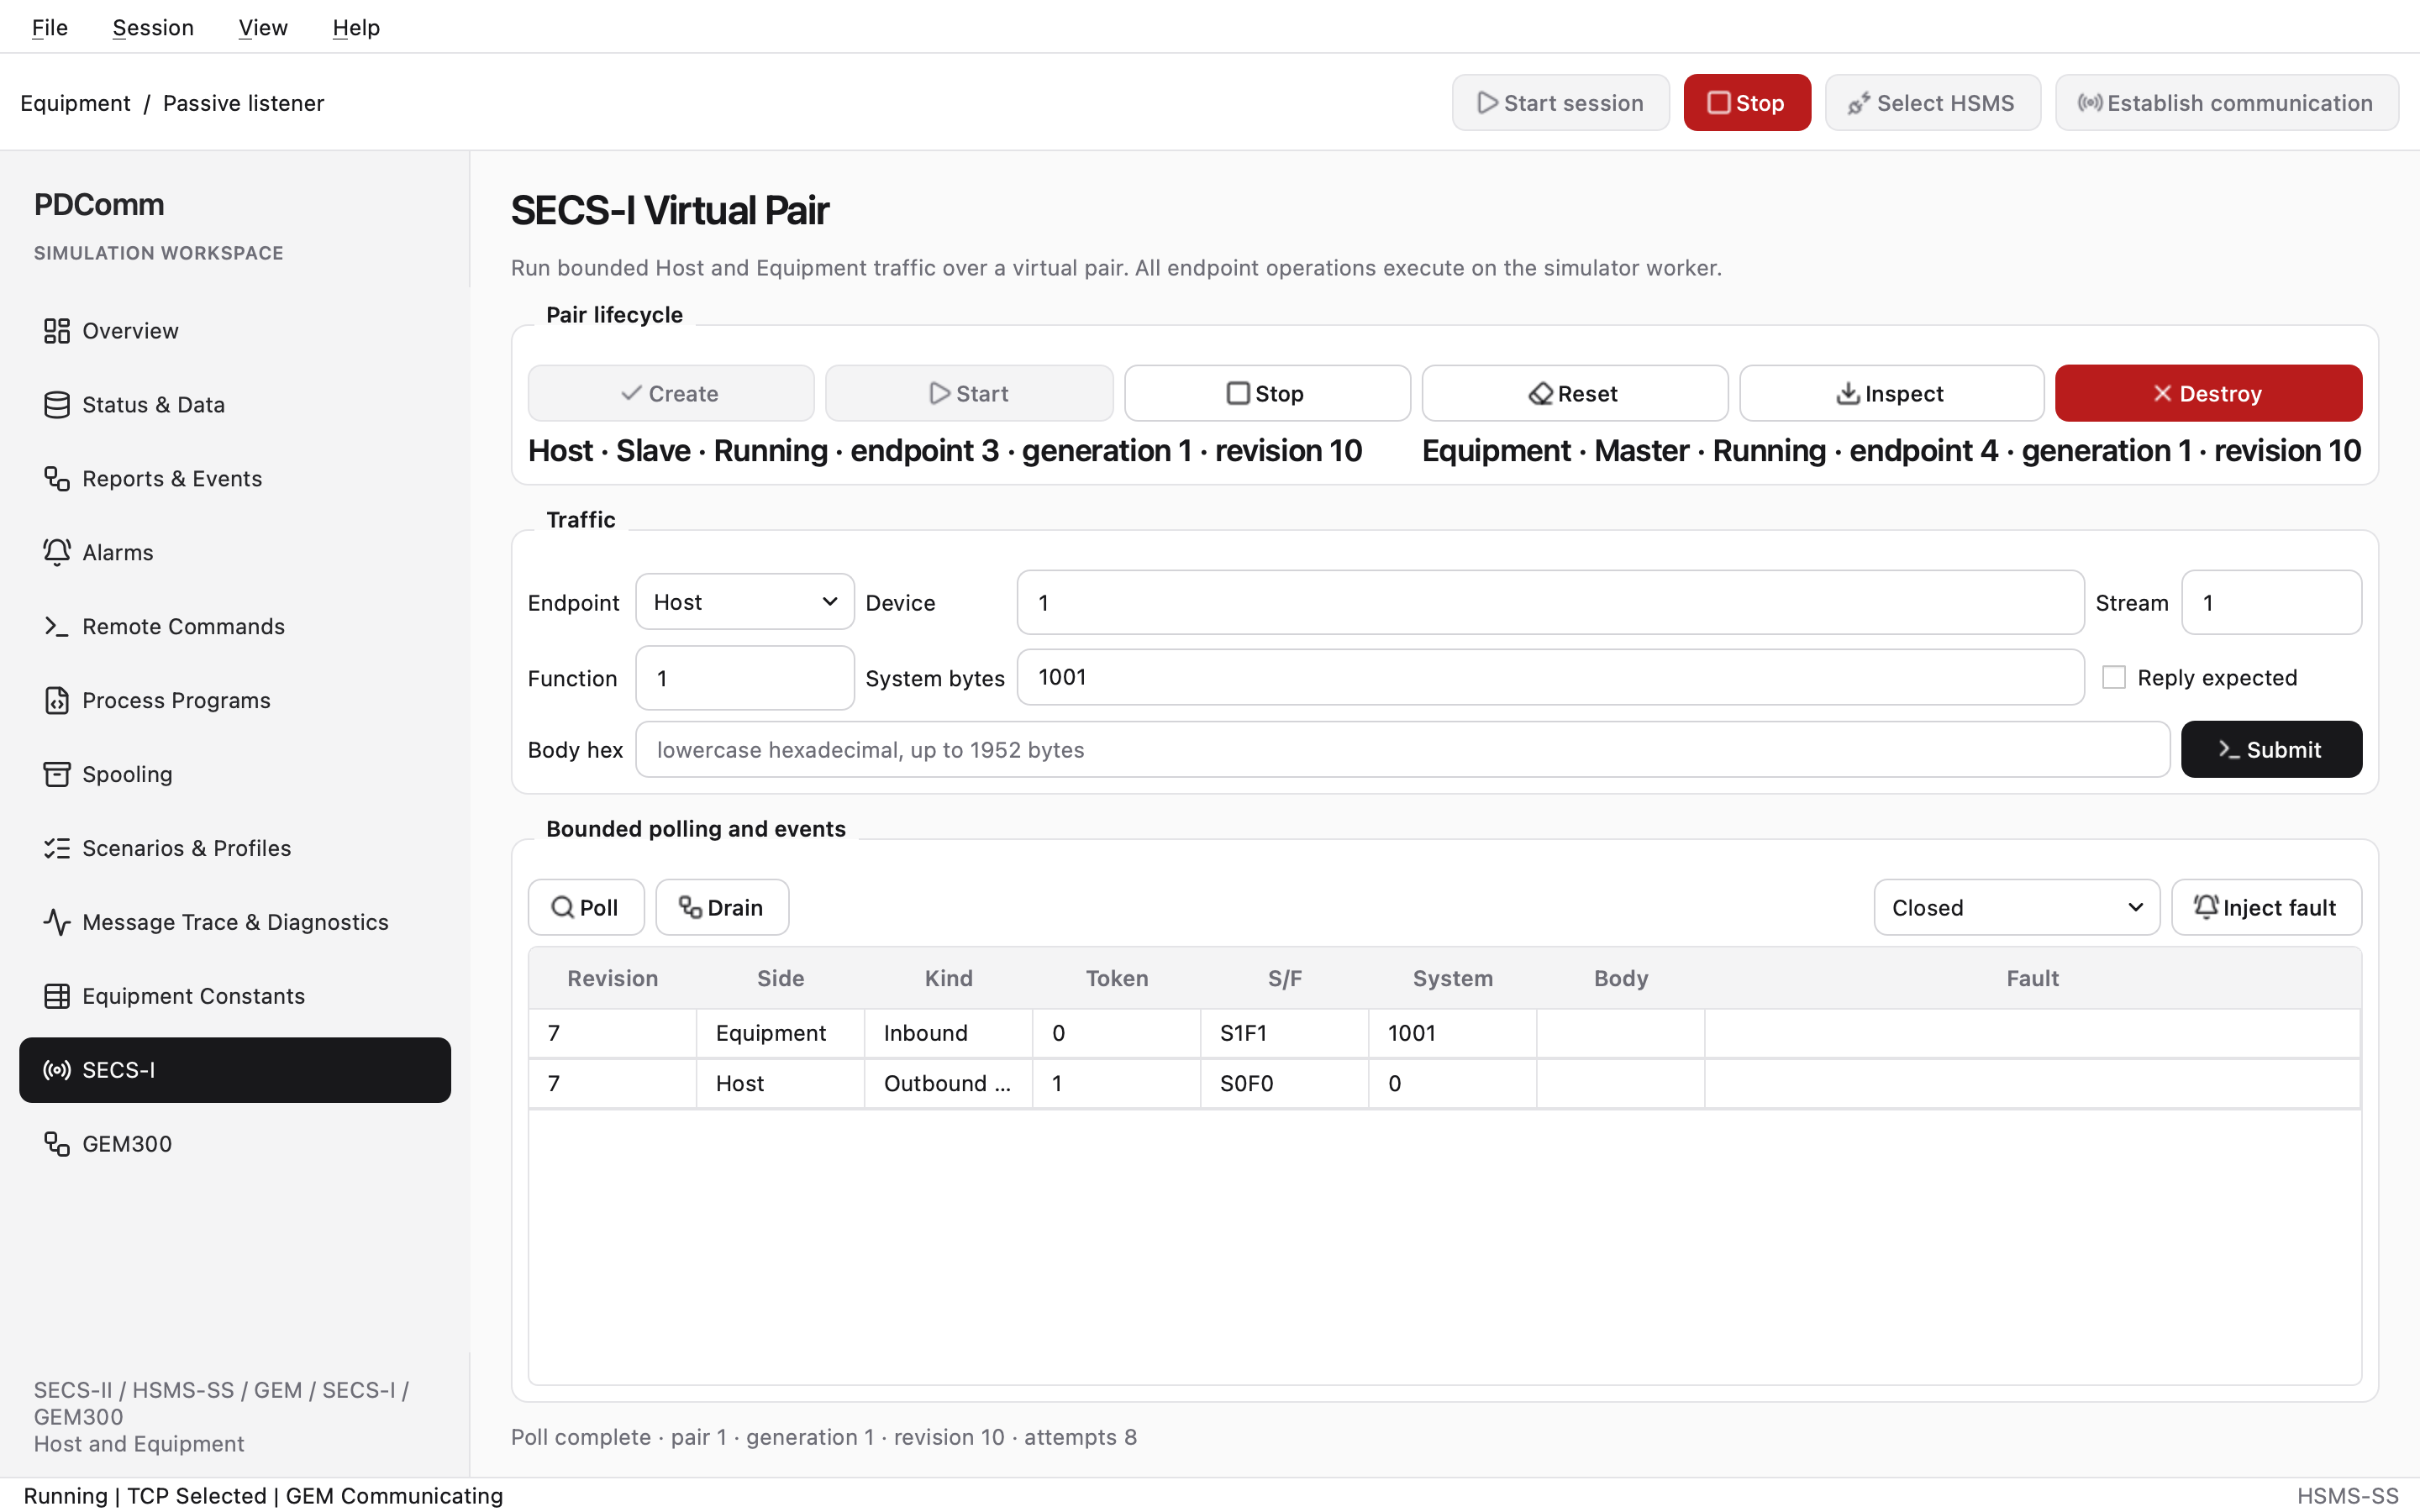
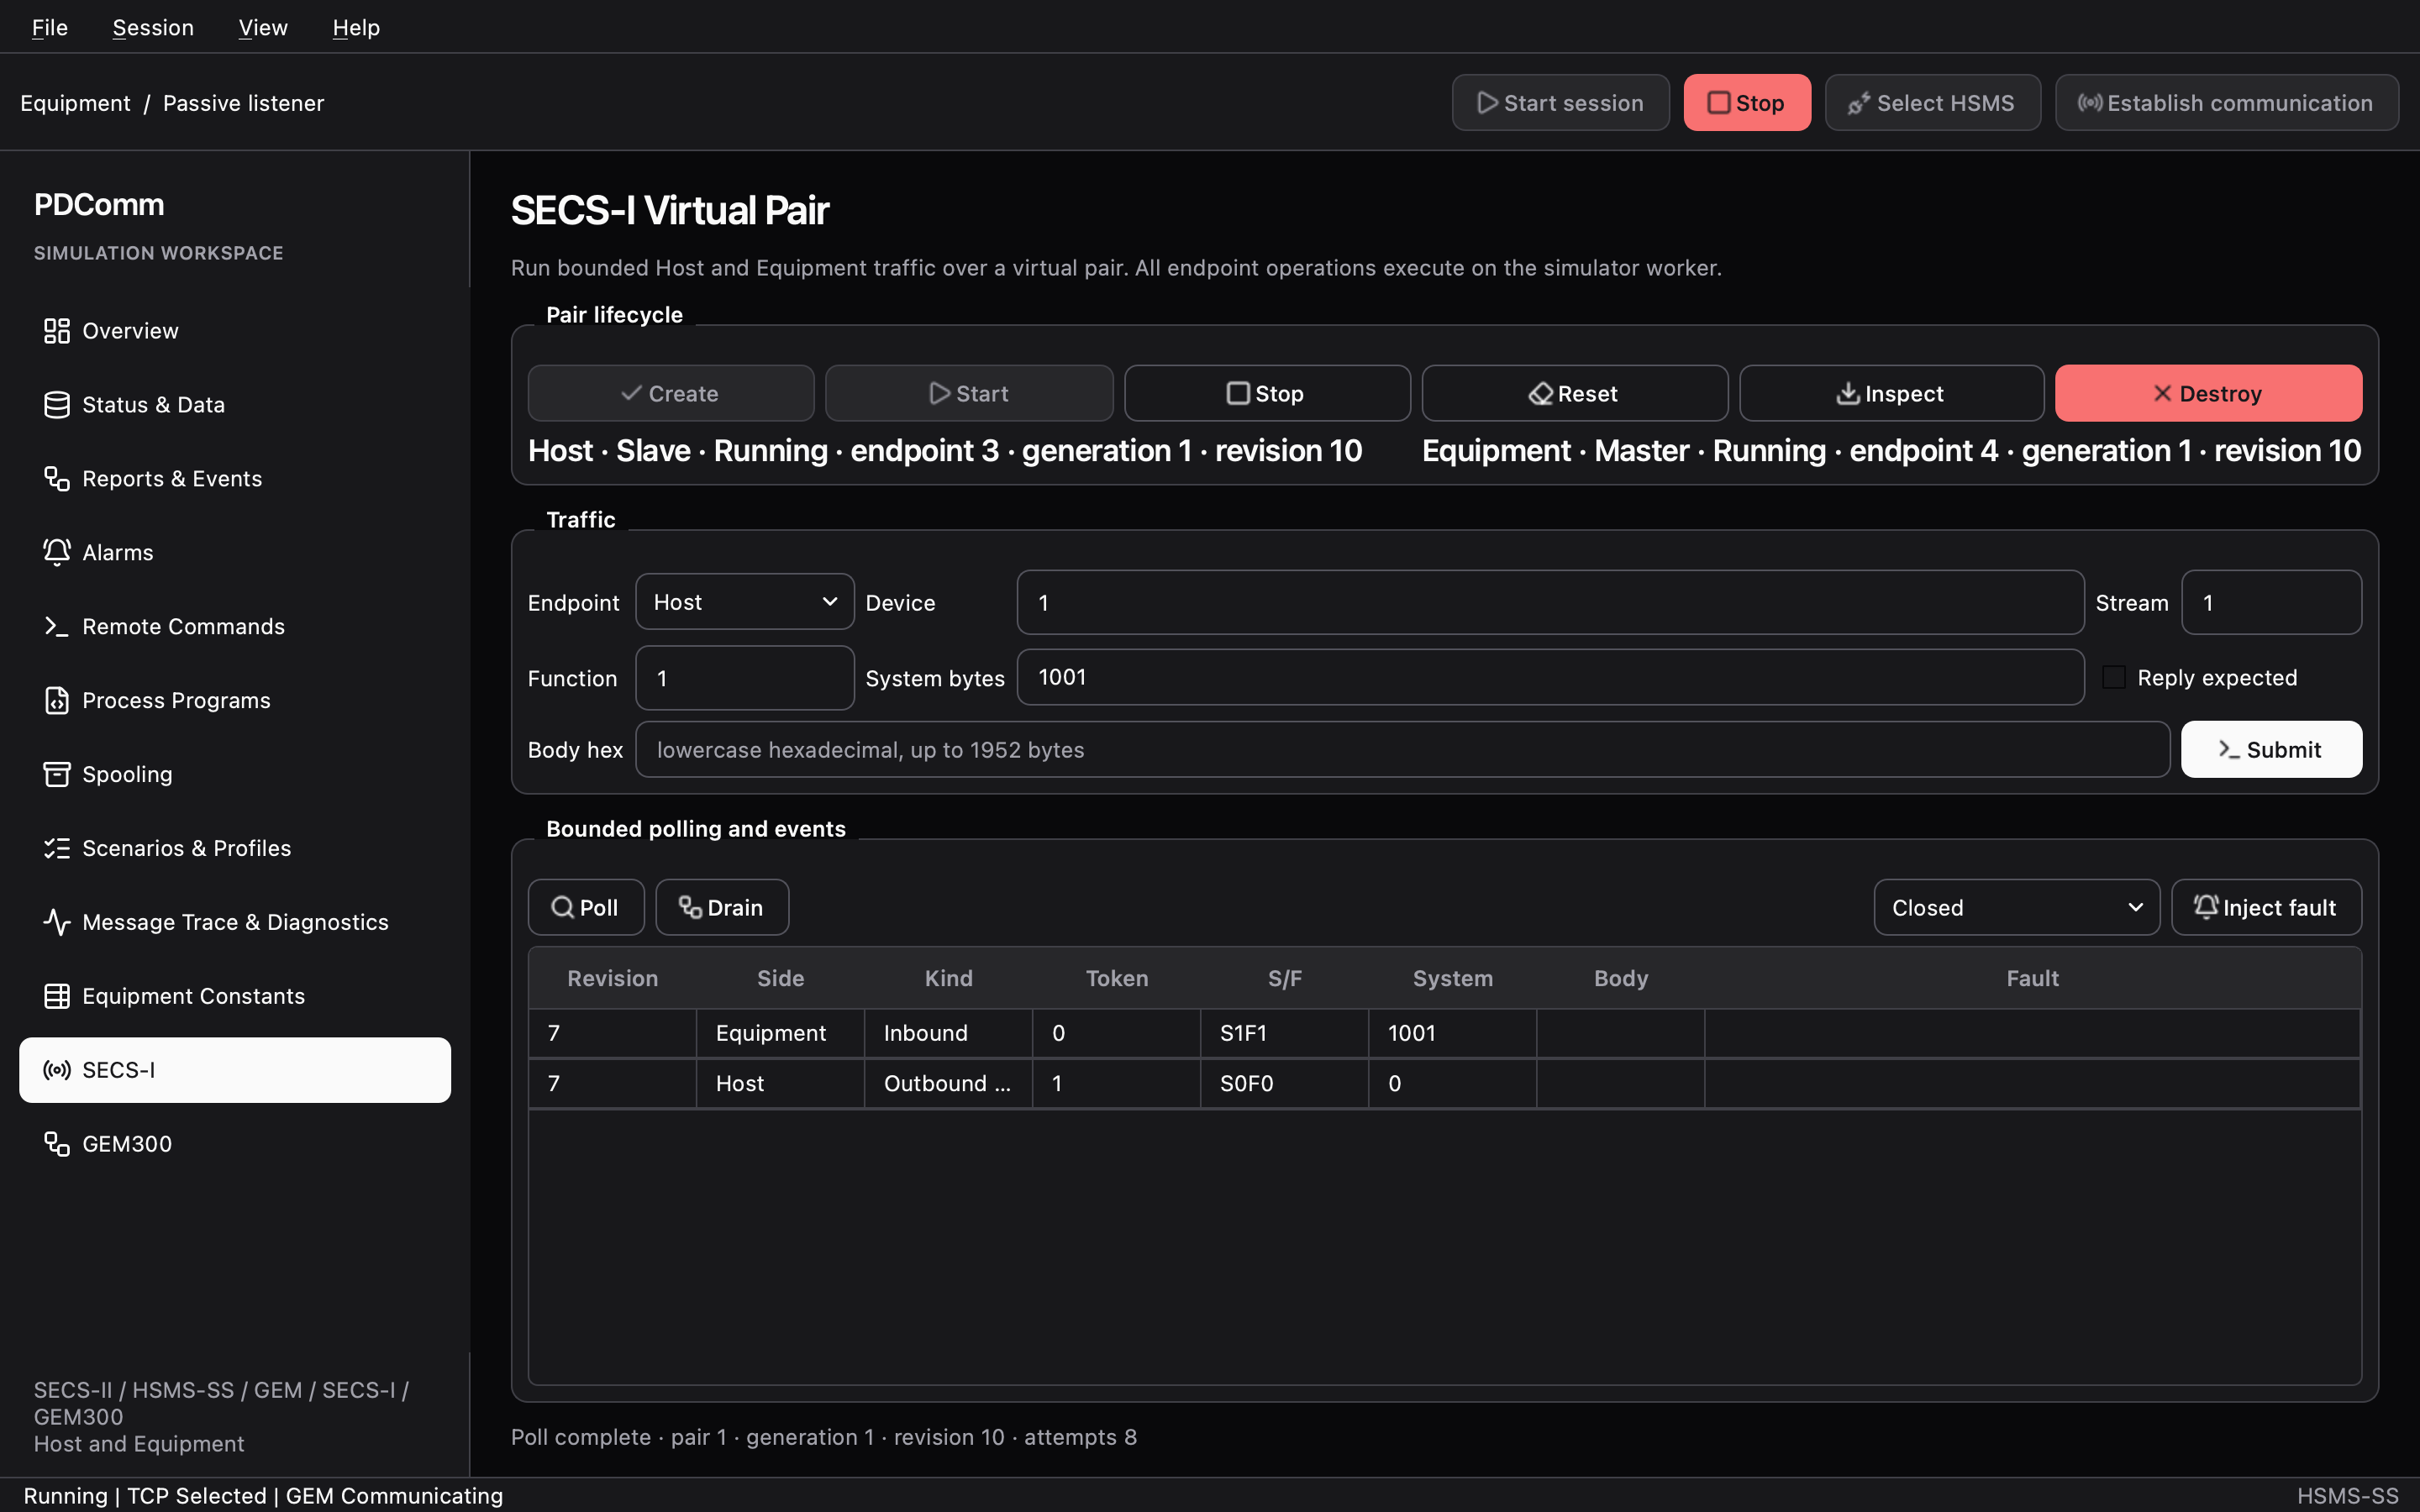
Section titled “SECS-I”The panel title is SECS-I Virtual Pair. It exercises SECS-I block transfer over an in-memory virtual pair inside the simulator, independent of the role and session on Overview. See SECS-I virtual pair for a full walkthrough.
GEM300
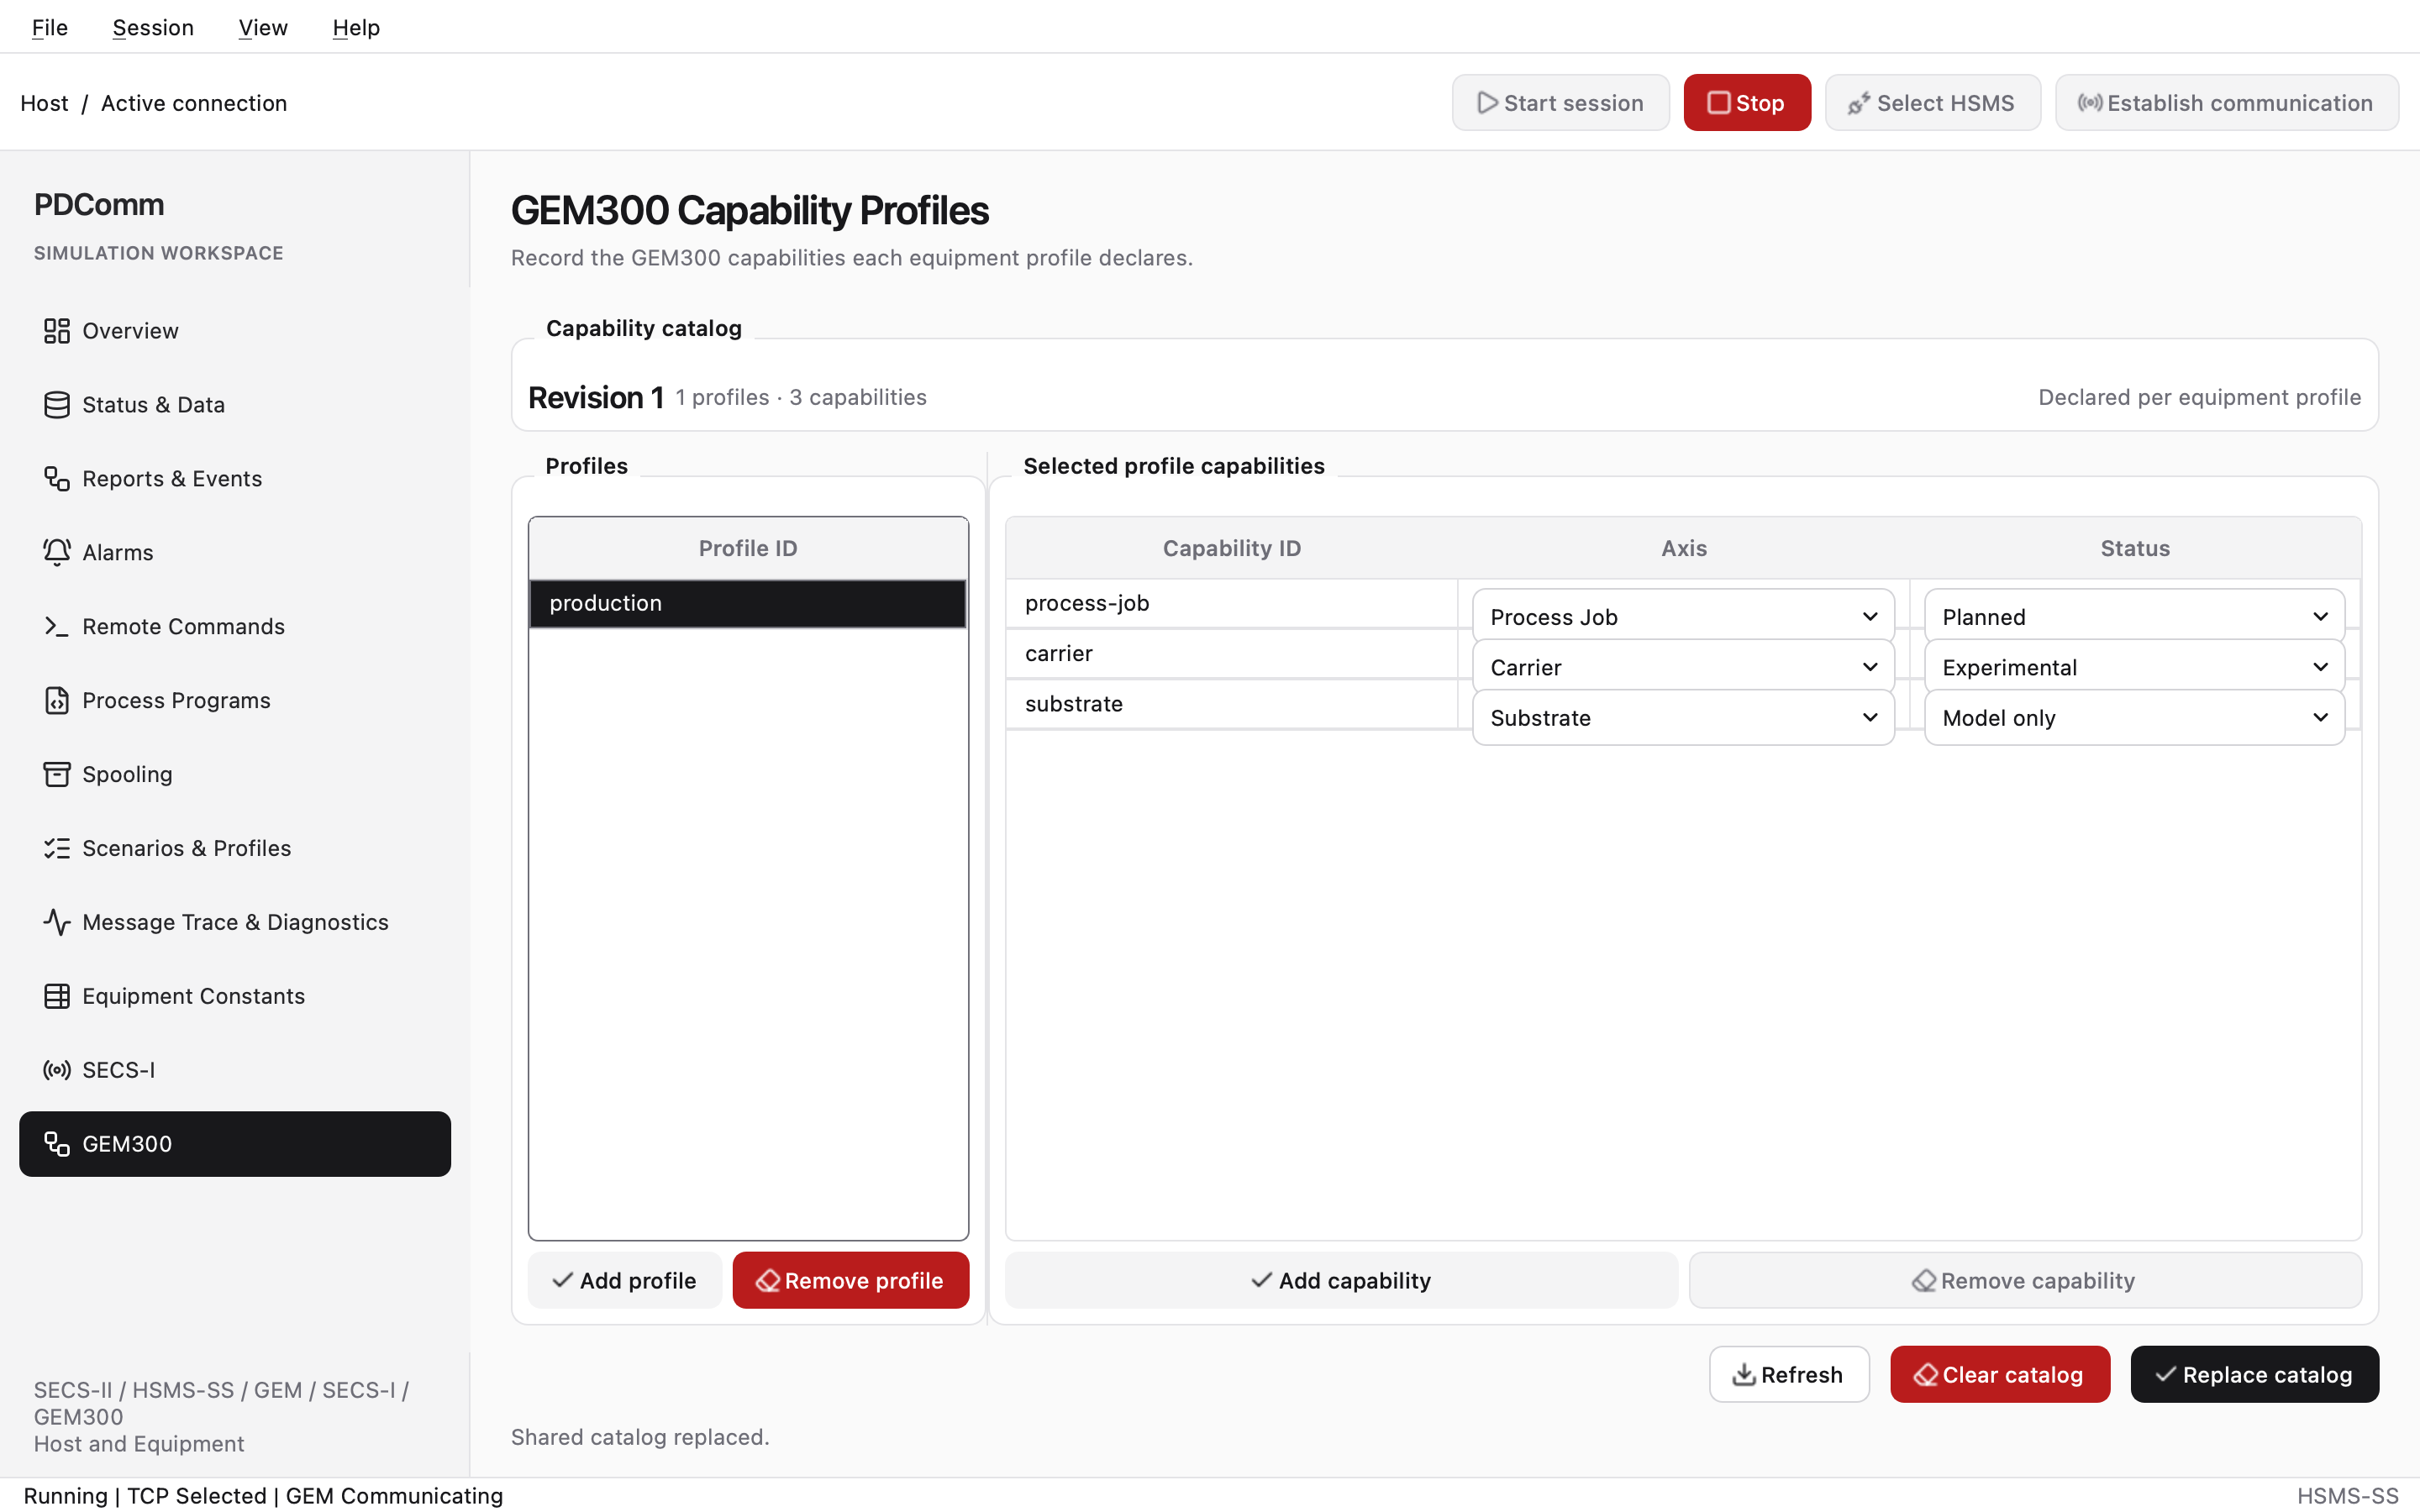
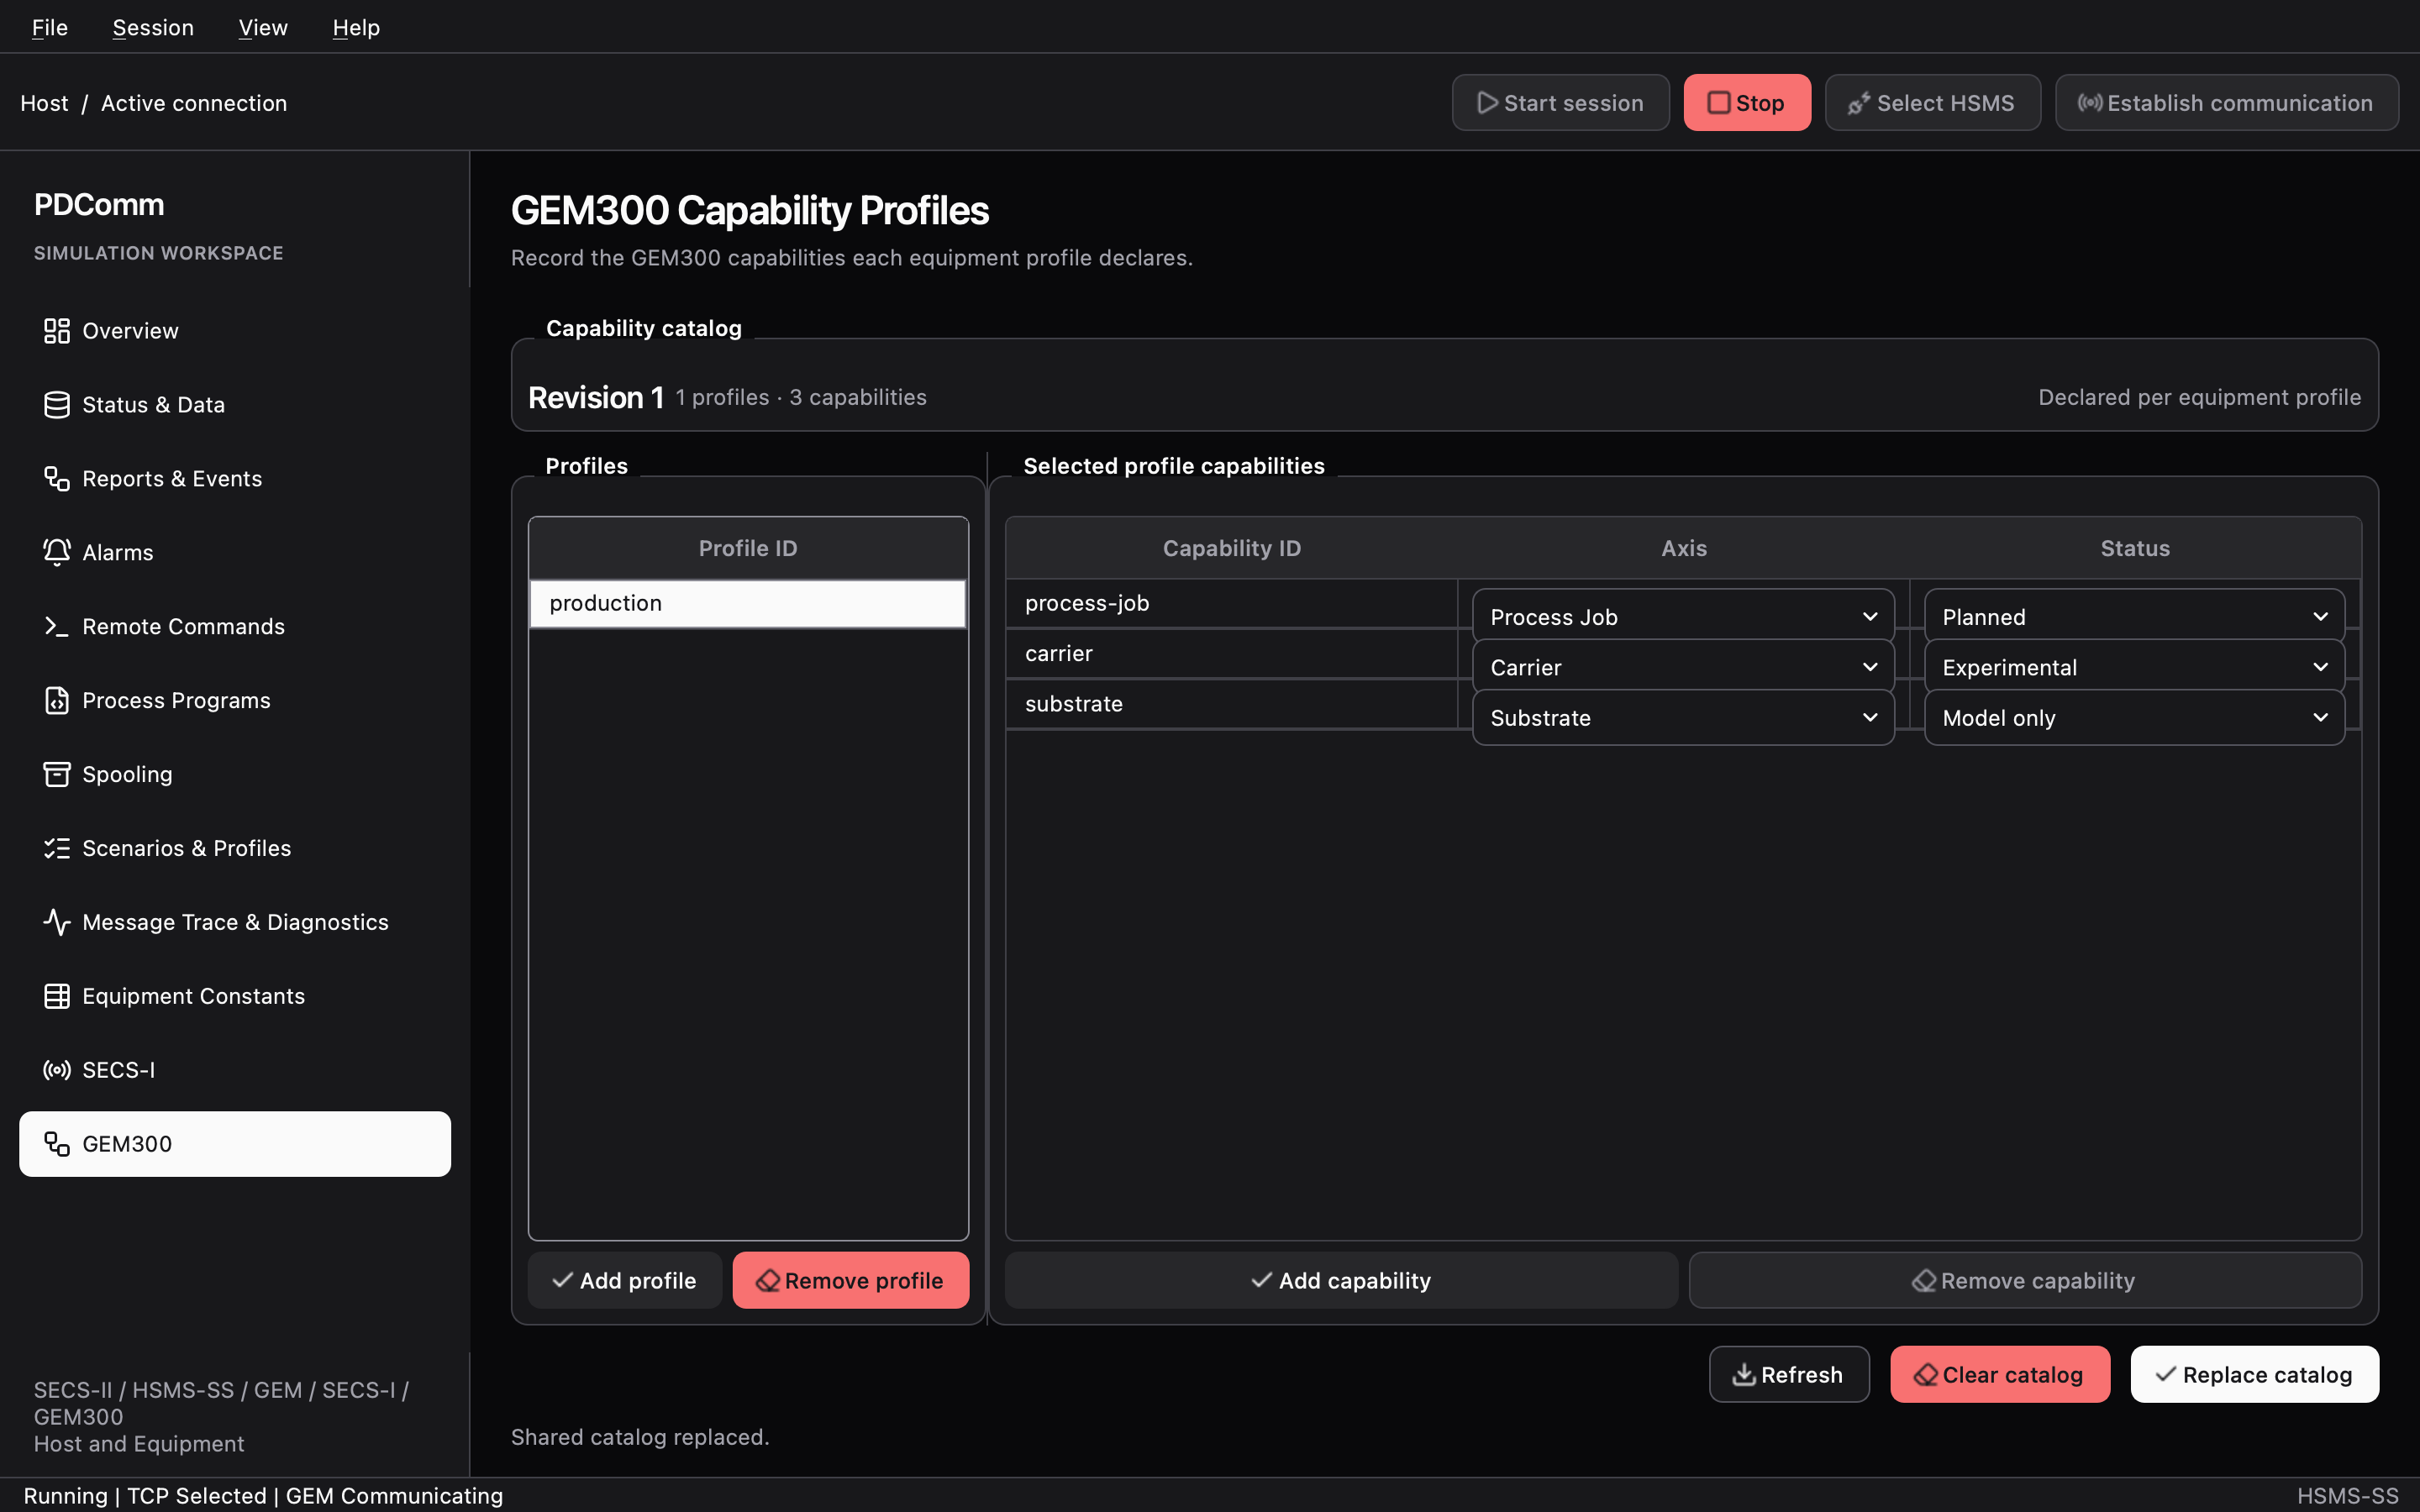
Section titled “GEM300”The page title is GEM300 Capability Profiles. Here you edit a catalog that declares, profile by profile, the GEM300 capabilities of an equipment configuration.
- Profiles: manage up to 16 profiles with Add profile and Remove profile.
- Selected profile capabilities: each profile holds up to four capabilities, one per axis. Axis is Process Job, Carrier, Substrate, or Control Job; Status is Planned, Model only, or Experimental.
- Replace catalog replaces the shared catalog immediately, Clear catalog empties it, and Refresh reads it again.
The catalog exists only inside the process and is not saved in the project file. For background, see GEM300.
Save and open projects
Section titled “Save and open projects”A project file (*.pdcomm.json) holds the Equipment’s next-start reservations, profiles, and scenarios.
| Saved | Not saved |
|---|---|
| Reservations for constants, reports and events, alarms, commands, process programs, spooling, data variables, and the static directory; profiles; scenarios | The GEM300 catalog, SECS-I virtual pairs, the trace, the next-start profile reservation, open sockets, and pending requests |
- In each workspace, reserve or clear your drafts. Saving fails while a draft has unsaved edits.
- End the session with Stop and End session. Opening and saving projects requires that no session exists.
- Choose File > Save Project As… and save the file in a folder you own. The file dialog is titled Save Simulator Project.
- Later, choose File > Open Project… to load it. If you have unsaved changes, the Discard unsaved changes? dialog asks before it replaces them.
The simulator opens project files up to 1 MiB. You can pass the same file to the --project option of the headless simulator.
Command-line options
Section titled “Command-line options”The GUI can also act as an MCP (Model Context Protocol) server.
| Option | What it does |
|---|---|
--mcp-stdio |
Serves MCP over standard input and output and controls the sessions and the window of this GUI. |
--mcp-local <descriptor-path> |
Opens an authenticated local MCP listener and writes a descriptor file that pdcomm-simulator-mcp-attach connects through. |
You can’t combine the two options. For details, see Simulator MCP server.
Next steps
Section titled “Next steps”- Connect your own SDK program to the simulator in First communication.
- Run the same scenarios without a window in the headless simulator.
- Look up the APIs behind each feature in the API reference.